Bitcoin inched towards $18,500 on Tuesday night. A sell-off occurred, and the cryptocurrency lost its support base of $18,000 in the early Wednesday hours. But ahead of the US session, it managed to secure the $18,000-support all over again.
The seesaw intraday price move in the Bitcoin market shows that bulls are in full control. Any attempt to mass short the cryptocurrency’s local tops are getting outnumbered by an increasing buying hysteria. As a result, the BTC/USD exchange rate is sustaining its short-term bullish bias as it attempts to retest its all-time high near $20,000.
Independent market analyst Cole Garner stated in a Wednesday tweet that Bitcoin is far from topping out. He cited three on-chain metrics that show why the cryptocurrency’s parabolic rally will likely go higher in the coming sessions.
#1 Exchanges’ Balances
Data fetched by Glassnode, an on-chain analytics firm, shows that the Bitcoin balances on all the cryptocurrency exchanges are declining rapidly against the rising prices.
The number of Bitcoin units held by trading firms is dropping. Source: Glassnode
Many analysts agree that traders withdraw Bitcoin en masse from exchanges when they don’t plan to trade it for other assets. The analogy comes from a common safety standard that promotes the idea of depositing only those cryptocurrencies with exchanges that traders may want to trade.
As of now, the Bitcoin balances are going down. It proves that traders want to hold the cryptocurrency, thereby removing the market supply against rising institutional demand.
#2 Miner’s Position Index
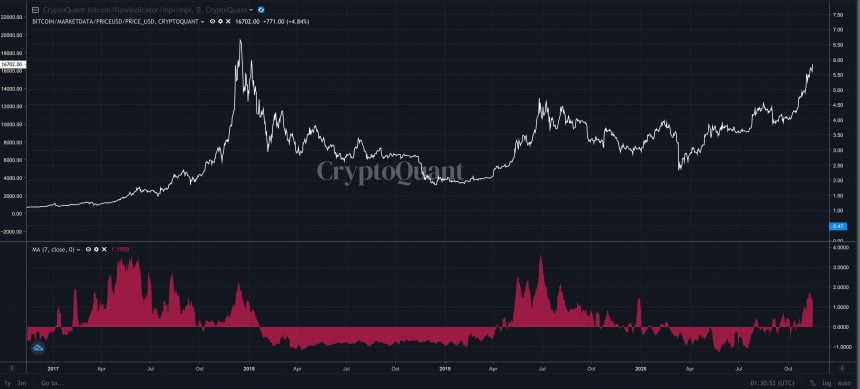
Mr. Garner provided further evidence of an extending Bitcoin rally with the Miner’s Position Index (MPI).
In retrospect, the MPI shows how miners’ Bitcoin positions can impact its prices. A reading above 2 illustrates that they are selling their cryptocurrency rewards right after earning them. Conversely, a reading below zero shows that they have become “HODLERS,” i.e., accumulating their BTC rewards.

Bitcoin Miner's Position Index. Source: CryptoQuant
“Miner’s Position Index has not yet hit the danger zone,” said Mr. Garner after noticing the MPI under ‘2.’
#3 Minimal Bitcoin Sell Orders
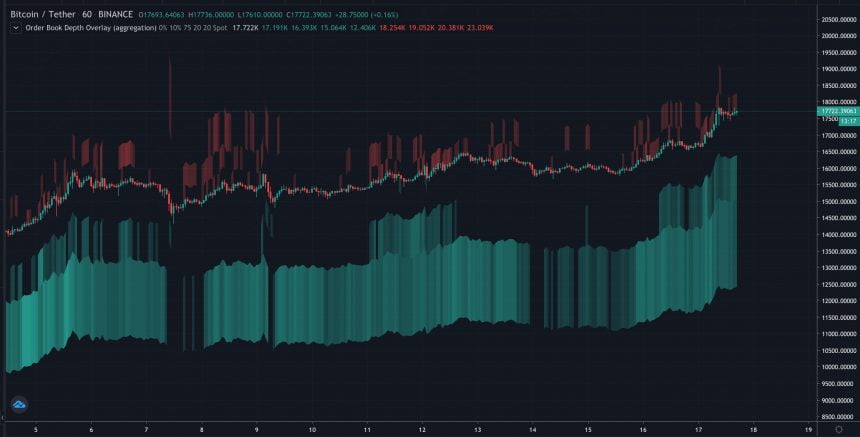
As stated above, any attempts to sell-off Bitcoin are meeting incredible buying demands. And the hourly Binance BTC/USDT order book shows why.

Bitcoin-Tether Order Book. Source: BTCUSDT on TradingView.com
The chart above shows that Binance’s aggregated order book has barely any sell volume. On the other hand, its buy volume is astonishingly higher. It further shows that more and more traders are buying Bitcoin only to withdraw them later to their private wallets to hold.
Therefore, BTC/USD hitting its previous bubble peak of $20,000 looks like a doable task.


