Bitcoin (BTC), the leading cryptocurrency, has defied expectations of a steep decline to sub-$20,000 levels and has rebounded to the $26,000 mark, registering a 3.5% gain over the past 24 hours.
This resurgence in Bitcoin’s price coincides with the predictions made by Chartered Financial Analyst Timothy Peterson, whose recent social media post outlined the probabilities of Bitcoin dropping to $22,600 or rallying to $31,200 within the next 90 days.
Bitcoin Price Analysis, 8% Chance Of Drop To $22,600
Peterson’s analysis indicates an 8% likelihood of Bitcoin experiencing a downward movement to $22,600, while a 71% chance of the cryptocurrency surging to $31,200.
According to the chart above, Bitcoin’s price will likely enter a macro consolidation phase over the next 90 days. During this period, the price may fluctuate within the range of its key Moving Averages (MAs).
However, the crucial factor for bullish investors is the low probability of a drop below $22,000. This allows them to regain control of the 50-day and 200-day MAs in the short term, currently positioned at $27,200 and $27,000, respectively.
The recent recovery of Bitcoin to the $26,000 level has alleviated concerns among market participants who were apprehensive about a potential downward spiral. The cryptocurrency’s ability to bounce back has instilled renewed confidence among investors.
Nevertheless, Bitcoin faces a series of resistance levels that could pose challenges. In the immediate term, resistance at $26,454 has temporarily halted the cryptocurrency’s upward momentum.
As mentioned earlier, Bitcoin lost its key MAs in August, resulting in additional obstacles on its journey back to $30,000. However, if these resistance levels are surpassed, there remains only one more hurdle before the cryptocurrency can surpass its annual high zone.
This final resistance stands at $29,800, which has historically proven to be a formidable barrier whenever Bitcoin has aimed to achieve new highs.
Imminent Final Decline Expected?
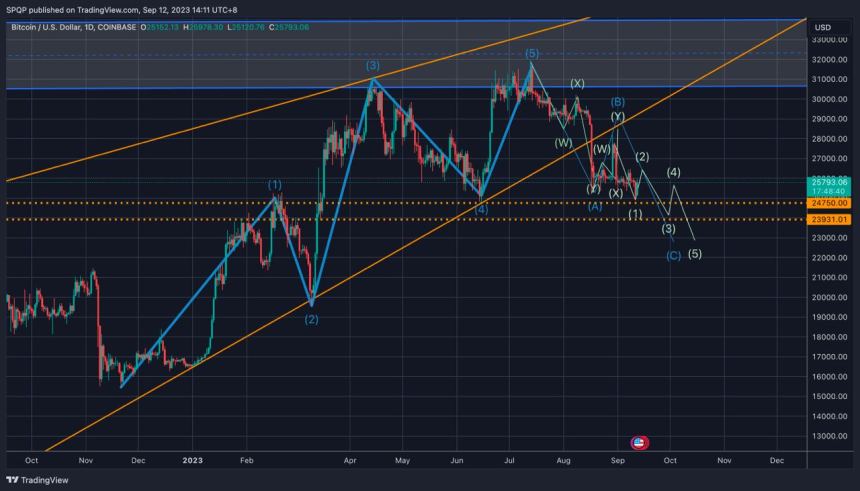
As the market approaches the final weeks of Q3 and edges closer to the new year, QCP Capital, an analysis firm, has been closely monitoring the market using two critical blueprints: the supermoon cycle and the Elliot Wave count. According to their analysis, an imminent final decline is expected to close the quarter at its lows.

The chart above illustrates the projected decline, aligning with QCP Capital’s blueprints. The firm believes that the crypto and macro events calendar also supports this view, with a concentration of upcoming bearish events expected to transition to a neutral stance from mid-October onwards.
Notable future events include tomorrow’s likely higher-than-expected CPI (Consumer Price Index) data and a more hawkish-than-expected Federal Open Market Committee (FOMC) meeting next week.
Additionally, asset sales of FTX tokens and the conclusion of the Mt. Gox proceedings over the next month contribute to the bearish sentiment.
Although QCP Capital’s theory suggests a potential bottom soon after the supermoon early next month, they anticipate the true bottom to materialize in mid-late October when the negative news cycle has run its course. They expect the market to stabilize during this time and potentially reverse its downward trend.
Despite the short-term challenges, QCP Capital remains bullish on the overall outlook. They anticipate a positive trajectory from mid-late October, extending into year-end and Q1 of the following year.
BTC is currently trading at $26,100, reflecting a 3.5% increase over the past 24 hours and a gain of over 1.5% in the past seven days.
Featured image from iStock, chart from TradingView.com


