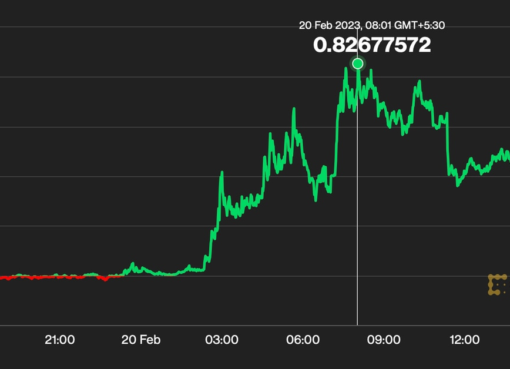
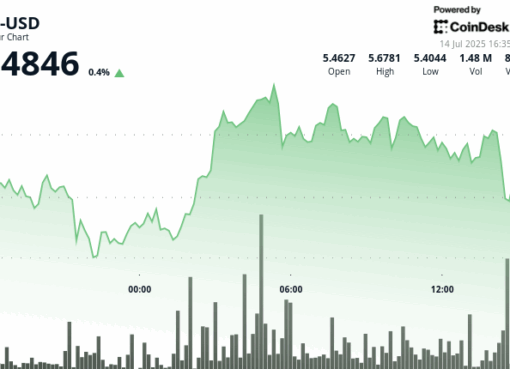
XRP bulls are trying to ride the wave along with Bitcoin to reclaim previously lost territory. The bulls are targeting new annual highs.
XRP has been trading in the green zone since the beginning of the year with a strong recovery and bullish sentiment from its investors. At press time, XRP is trading at $04.96, representing a gain of 0.78% in the last 24 hours. The token is auctioning 34% below its 2018 high of $3.40.
Can XRP Sustain Its Bull Streak?
XRP started the year with a spike in volatility that characterized the market and has been able to profit 11.85% in the last 30 days, pushing its market cap to $20.6 billion.
In addition, the trading volume that XRP has experienced in recent days and weeks and the profitable trend of XRP shows that market makers are involved in the project. According to a recent report from NewsBTC, it’s possible to assume that XRP whales are once again buying and accumulating the token.
This increase in activity in the XRP Ledger’s native token suggests that more wallets are being created with large amounts of XRP. While the perspective of many investors may be bullish, we can also find traces that lead us to consider a bearish scenario.
XRP can break the trend line that touches three key levels and continue its bullish trend to find a position in the following challenge represented by $0.5.
XRP Heaven or Hell Levels
Despite the breach of previous target zones, there are strong signals that XRP’s bullish days may be numbered. The current market scenario, where some tokens are consolidating or forming a range price, suggests that the price action can explode in any direction.
As with any pivotal moment in the market, this leaves XRP with two scenarios, which are explained in the following chart:
XRP can break the trend line that touches three key levels and continue its bullish momentum to find a position in the following challenge represented by $0.5.
On the daily chart above, XRP has formed a bearish divergence, which may represent a significant pullback for the token. The Relative Strength Index (RSI) sits at 42.51, approaching oversold territory, but for XRP, there needs to be a correction in the daily time frame before the price action can follow the RSI indicator.
If this is confirmed, XRP could significantly retreat to the $0.36 support level. If the bulls cannot stop this hypothetical scenario, the token may also lose territory and test the $0.288 level.
In short, XRP needs to find its momentum before a significant correction of the token and the cryptocurrency market, with Bitcoin (BTC) and Ethereum (ETH) forming bearish divergences on the daily charts.
Confirmation of the bearish divergences for XRP will be complete when the price action breaks below $0.379. In that case, bears may find themselves in the perfect scenario to ride down the hill to visit lower prices. If XRP’s downturn continues, it could retest $0.33, the following primary support line for the token.


