The XRP price has increased significantly in the past 24 hours. The coin registered over 10% growth in the past day.
Over the last week, the coin brought in 10% appreciation as well. Overall, XRP bulls seemed to take control of the charts.
The coin could slowly attempt to trade near its next resistance mark, and with growing demand, it could get past that price mark.
The support zone for that price rested between $0.43 and $0.39, respectively. It is important for XRP to get back up to $0.51, which has been acting as a rigid price ceiling for the coin.
Once XRP moves up beyond $0.51, the coin will strengthen its bullish move. The technical indicator of the coin has signalled an increased bullish momentum.
The buyers have returned to the market, albeit with a decline. The decrease in selling strength will help XRP to move past the $0.51 level.
The global cryptocurrency market cap today is $978 billion, with a 2.2% positive change in the last 24 hours.
XRP Price Analysis: One Day Chart
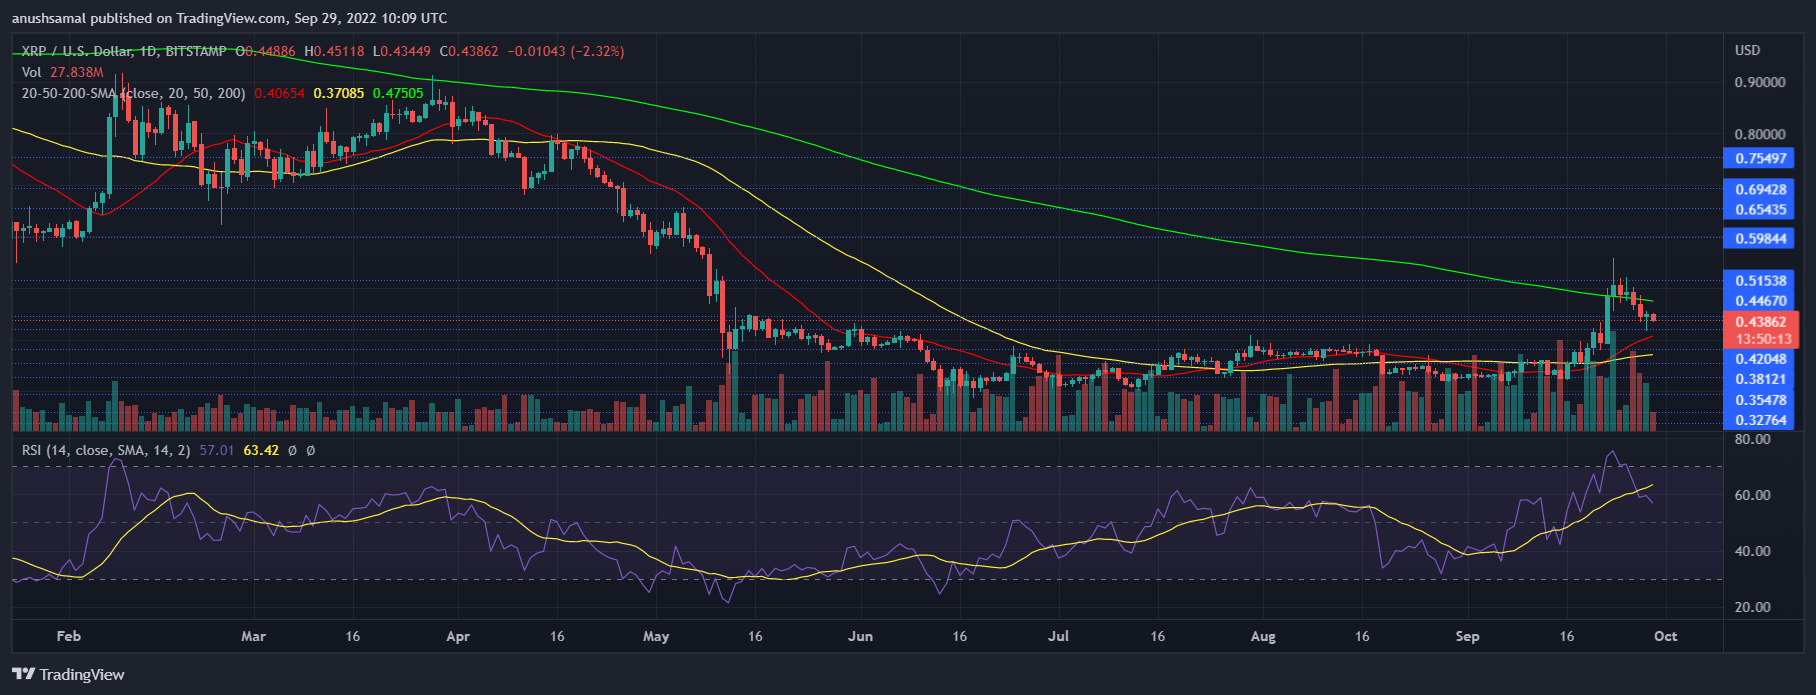
The altcoin was trading at $0.43 at the time of writing. XRP price had rallied sharply to $0.56 and then retraced on its chart.
Over the past day, however, the coin started to move up on its chart. The immediate resistance for the coin stood at $0.51 and then at $0.56.
On the other hand, the support line was at $0.41 and a fall from that level would cause the XRP price to dip to $0.34. That would make the bears stronger in the market.
The amount of XRP that was traded in the last session showed signs of decline, which indicated that buying strength might have dipped on the chart.
Technical Analysis

The altcoin was still controlled by the bulls on the one chart. The coin had gone through a pullback, which is why buying strength also fell on its chart.
The Relative Strength Index was above the half-line, and that indicated an increased number of buyers as compared to sellers. If demand falls, the sellers can take over at any moment.
The XRP price was above the 20-SMA line as well as 50-SMA, which indicated that demand was still quite high for the coin. It means that buyers were in control of the price momentum in the market.

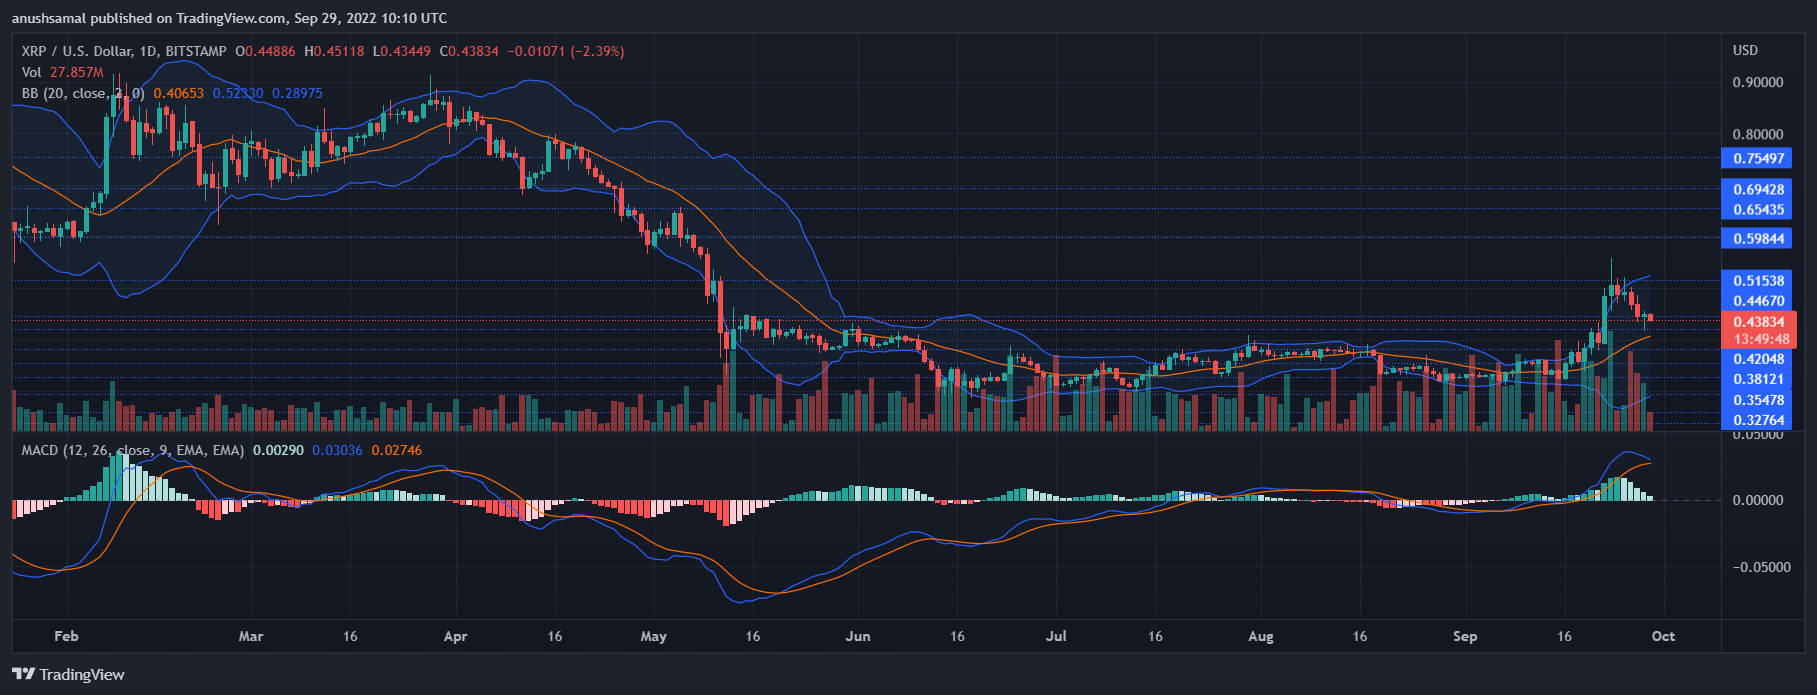
Other indicators also continued to display that buyers were present in the market. The Moving Average Convergence Divergence depicts the price momentum and overall price action of the coin.
MACD was positive with green signal bars, and that meant buy signal for the coin. The green signals were receding, which could mean that there might be a price pullback over the next trading sessions.
Bollinger Bands indicate price volatility and fluctuations. The bands widened, which is a signal that there could be heavy price volatility over the next trading sessions.


