The XRP price fell sharply yesterday as a result of Bitcoin’s flash crash, as did the entire altcoin market. The price briefly fell by 21% yesterday, plummeting from around $0.64 to $0.505. Although the price was still able to recover above the 200-day exponential moving average (EMA) in the 1-day chart at $0.5712 by daily close, it is still down around 10% compared to yesterday’s high.
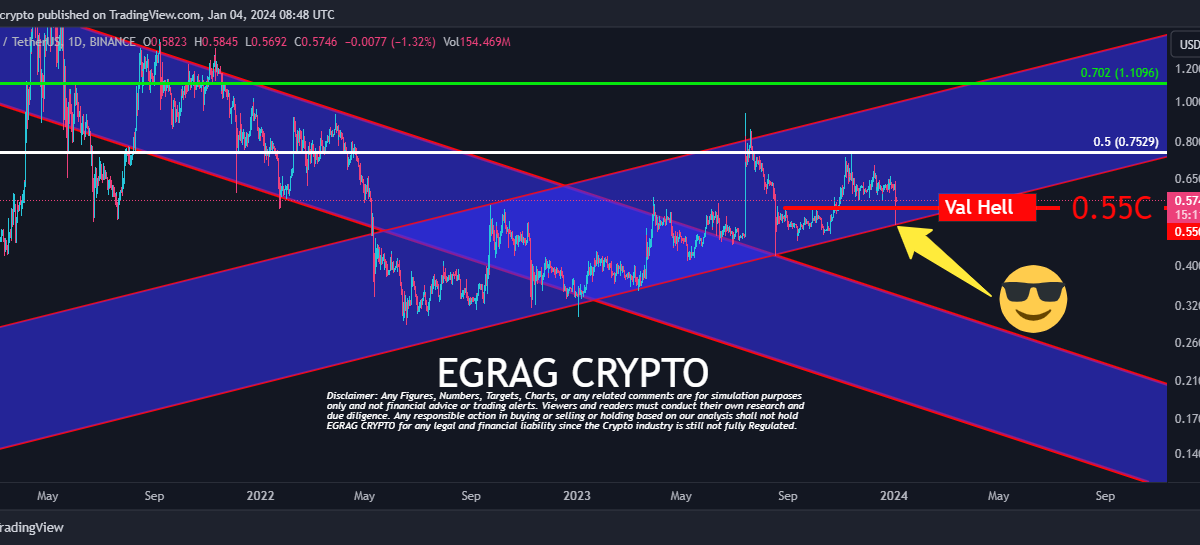
Nevertheless, crypto analyst Egrag Crypto remains bullish and was able to take some good out of yesterday’s crash. In his latest analysis of the 1-day XRP/USD chart, Egrag highlighted that the XRP price is in a preparation phase for an upswing. Egrag’s chart presented on X provides insights into the XRP’s current position and potential future movements.
XRP Price Gearing Up For An Upswing Soon?
Egrag’s analysis starts by revisiting the August scenario where XRP touched the lower boundary of its ascending channel amidst a massive liquidation in the crypto space amounting to $1 billion. Fast-forwarding to the present, XRP is once again at this critical juncture with a similar scale of liquidation occurring yesterday.
“Now, after five months, it’s revisiting that zone with another aggressive $1 billion liquidation,” Egrag notes. Remarkably, the XRP bulls defended once again the lower trendline of the ascending channel which was established in May last year.
The XRP bulls‘ steadfast buying represents a strong bullish signal, particularly as they have maintained the price above the so-called “Val Hell Line” at approximately $0.55. Egrag identified this line as the most crucial support line.
A fall below this level with the daily candle close could have signaled the beginning of a downward trend. But despite the market’s upheaval, Egrag highlights the bullish sentiment by noting, “Surprisingly, the XRP bulls have staunchly defended this channel, buying into the dip as if there’s no stopping them.”
Moreover, Egrag emphasized that another retest was pretty “standard market behavior” within the broader context. He views this retest as a potential consolidation phase, potentially building up to an upswing. “The bulls managed to triumph over the Val Hell Line, avoiding a daily candle close below it,” Egrag remarked.
Price Levels To Watch
Egrag’s chart also features Fibonacci retracement levels, particularly highlighting the 0.702 level at about $1.1096 and the 0.5 level at approximately $0.7529. Traders traditionally use these levels to gauge potential support and resistance zones, and Egrag’s chart indicates that these levels are important to monitor for the XRP price action.
The 0.702 Fib level could remarkably coincide with a breakout from the trend channel if the price reaches the level between April and May. In conclusion, the crypto analyst confidently states, “Personally, I’m increasingly confident that we’re gearing up for a significant upswing very soon. #XRPArmy, keeping an eye on the broader channel perspective keeps me calm and steady, cool and ready.”
At press time, XRP traded at $0.5791.
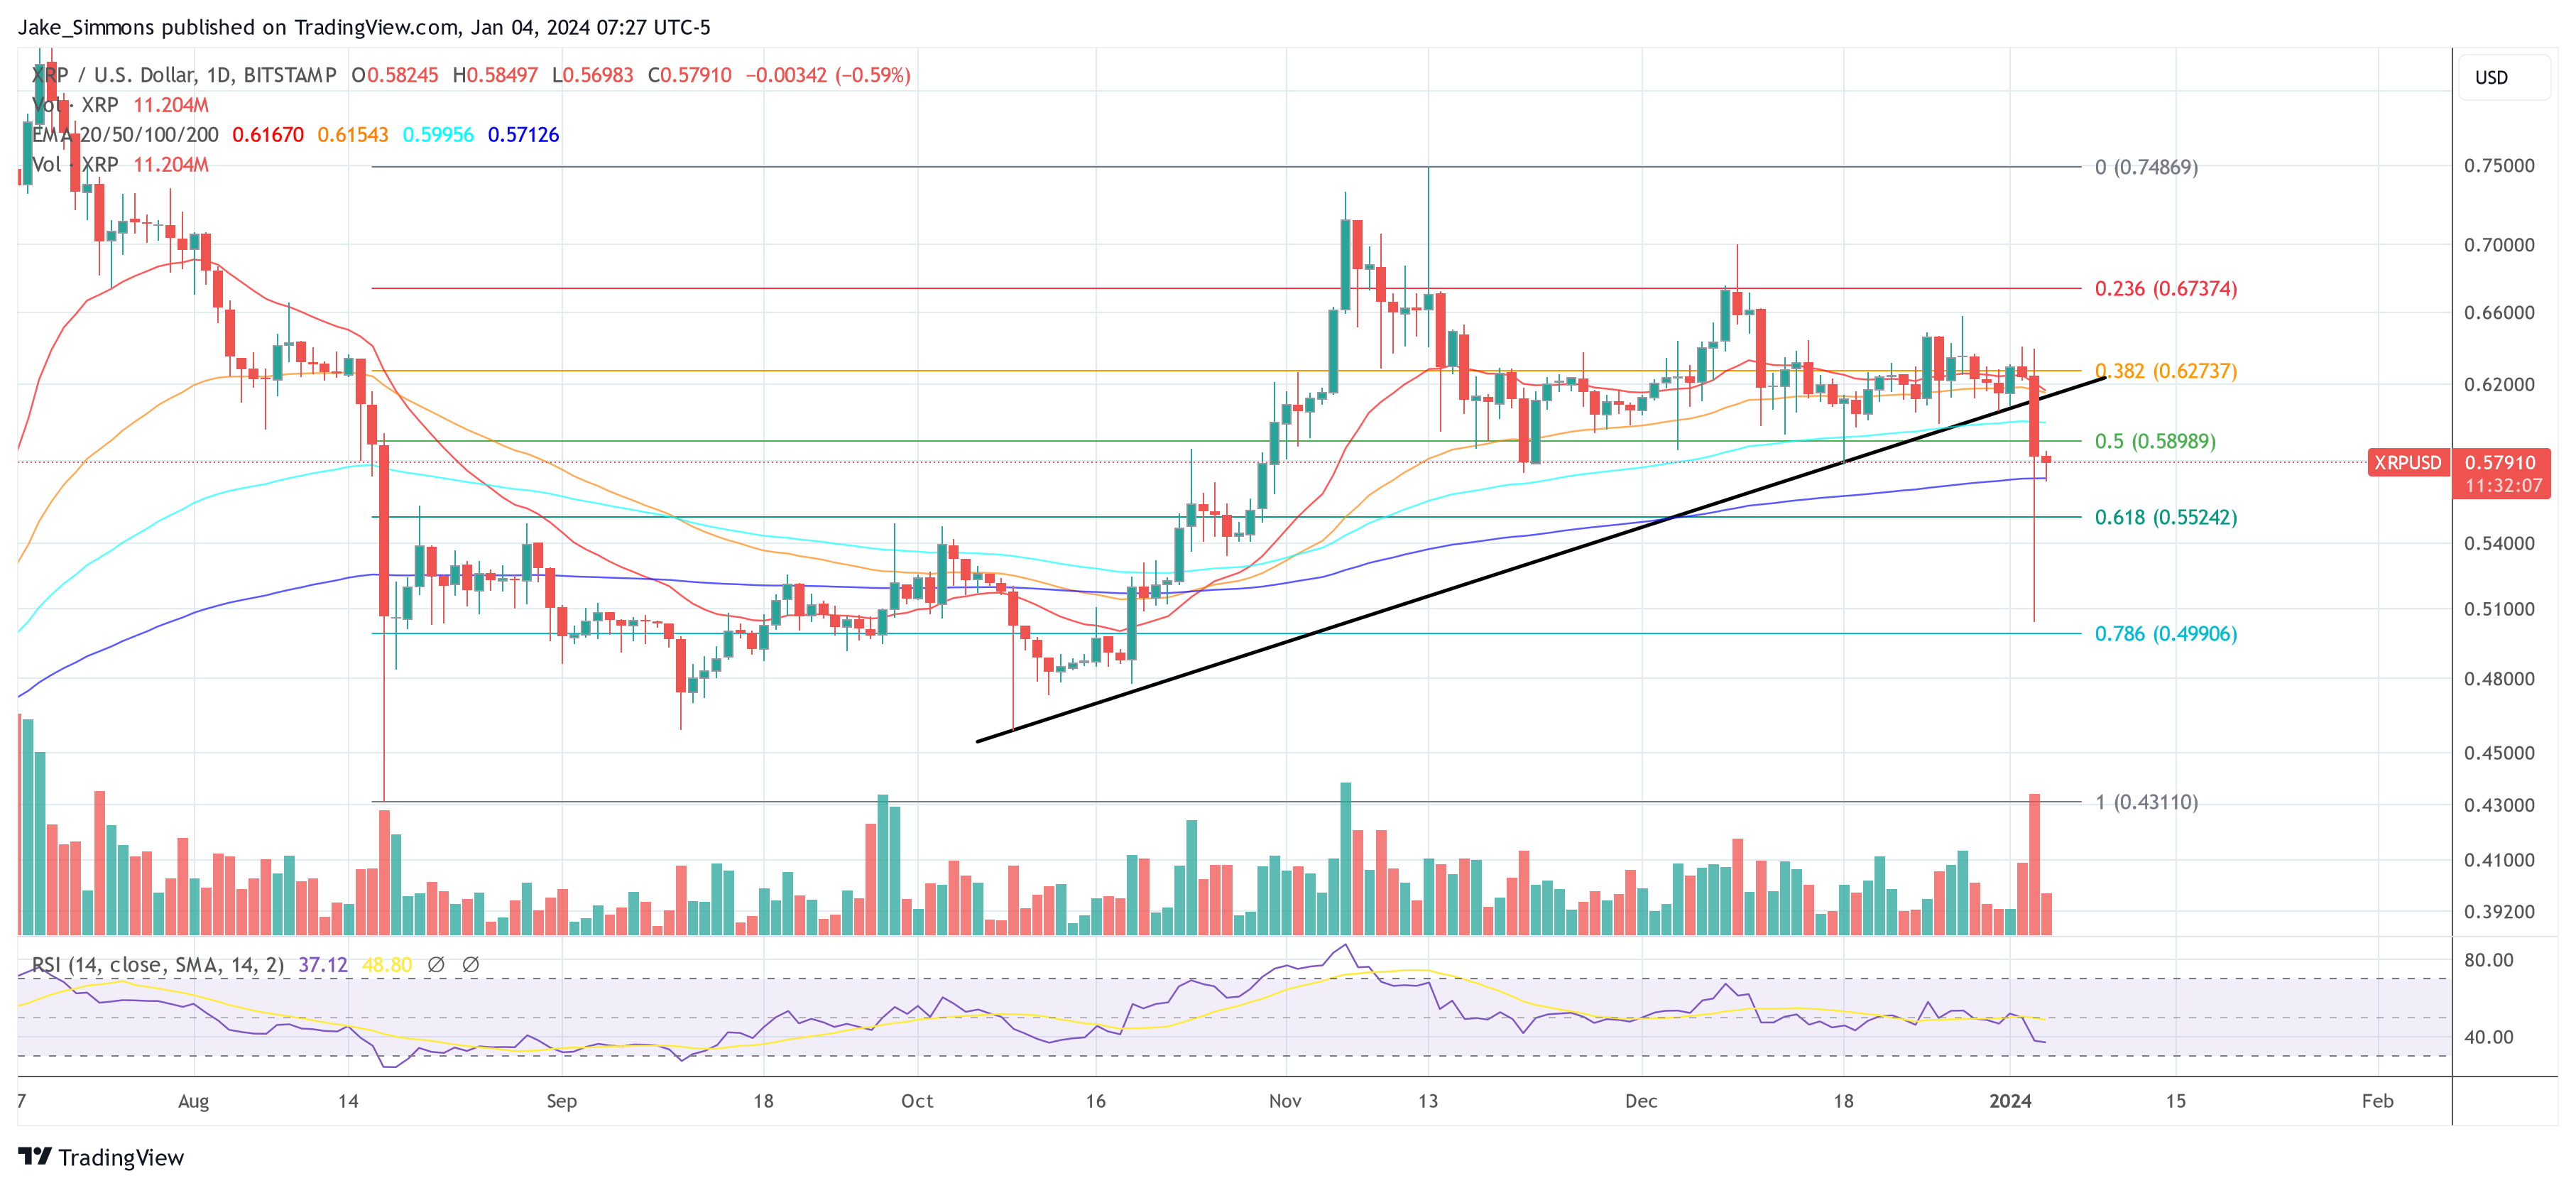
Featured image from Shutterstock, chart from TradingView.com
Disclaimer: The article is provided for educational purposes only. It does not represent the opinions of NewsBTC on whether to buy, sell or hold any investments and naturally investing carries risks. You are advised to conduct your own research before making any investment decisions. Use information provided on this website entirely at your own risk.

