

Bitcoin (BTC) witnessed solid buying over the weekend as US President Donald Trump announced that Bitcoin, Ether (ETH), XRP (XRP), Solana (SOL), and Cardano (ADA) would be included in a crypto strategic reserve. The announcement massively pumped the chosen coins, which made it risky for a fresh entry after the rally. The coins in this article have been selected for their technical setups rather than the Trump-based pump.
Apart from the crypto strategic reserve, in a sign that could create new demand for Bitcoin, BlackRock added the iShares Bitcoin ETF Trust (IBIT) to its $150 billion model portfolio, according to a Bloomberg report. The global investment firm is adding 1% to 2% allocation to portfolios that allow for alternative assets. This move opens the doors for a potential new demand for the Bitcoin ETF.
Crypto market data daily view. Source: Coin360
However, some analysts believe that Bitcoin could witness some more pain in the near term. They anticipate Bitcoin to drop near $70,000 before starting the next leg of the bull move. Nexo dispatch analyst Iliya Kalchev told Cryptox that Bitcoin could “establish firm support in the $72,000 to $80,000 range.”
Could Bitcoin manage to hold above $90,000? If that happens, select altcoins apart from the ones chosen for the crypto strategic reserve may find buyers. Let’s look at the top cryptocurrencies that look strong on the charts.
Bitcoin price analysis
Bitcoin has reached the 20-day exponential moving average ($92,366), indicating aggressive buying at lower levels.
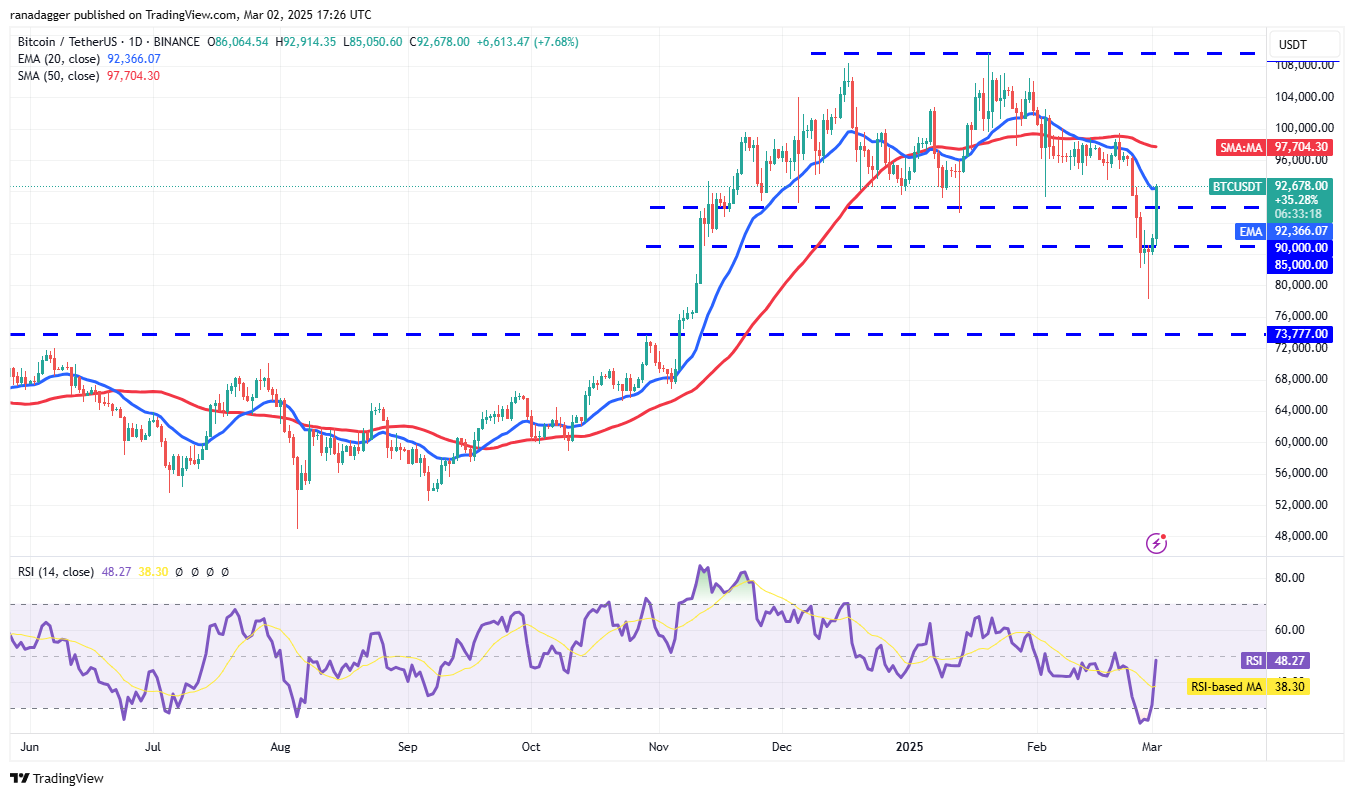
BTC/USDT daily chart. Source: Cryptox/TradingView
Sellers will try to stall the relief rally at the 20-day EMA. If the price turns down from the 20-day EMA, the BTC/USDT pair could drop to $85,000, which is a crucial support to watch out for.
If the price rebounds off $85,000, the pair could rise above the 20-day EMA. The pair may then rally to the 50-day simple moving average ($97,704). Such a move will signal that the pair may have bottomed out in the near term.
If bears want to retain the advantage, they will have to swiftly pull the price below $83,000. If they manage to do that, the pair could retest the critical $78,258 support.
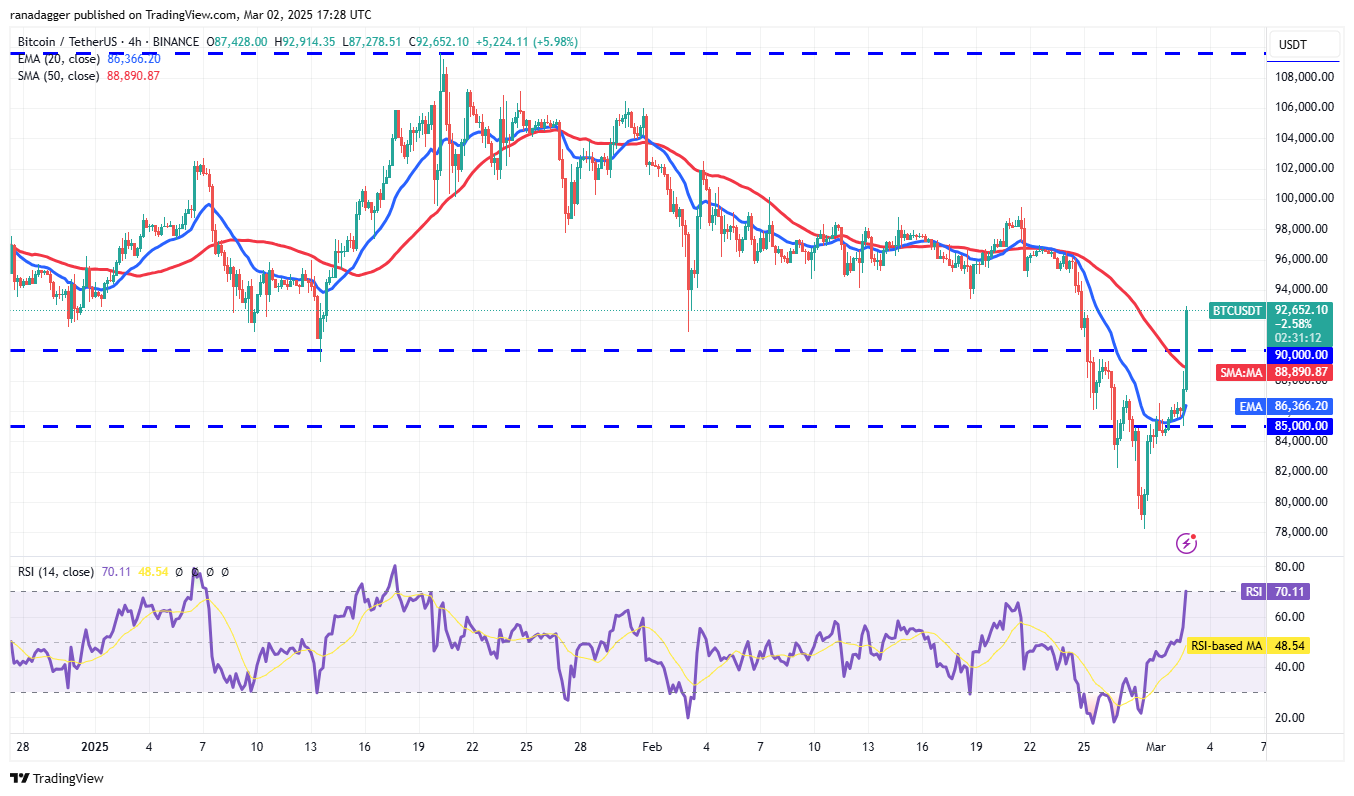
BTC/USDT 4-hour chart. Source: Cryptox/TradingView
The 20-EMA has started to turn up on the 4-hour chart, and the relative strength index (RSI) has jumped into the overbought zone, indicating that the bulls are on a comeback. If the price remains above $90,000, the pair could climb to $96,000 and then $100,000.
The first sign of weakness will be a break below the 50-simple moving average. That could sink the pair to the 20-EMA, which is likely to attract buyers. The bears will be back in the driver’s seat if they pull the pair below $83,000.
Hedera price analysis
Hedera (HBAR) rose above the 20-day EMA ($0.22) and reached the 50-day SMA ($0.26) on March 1.
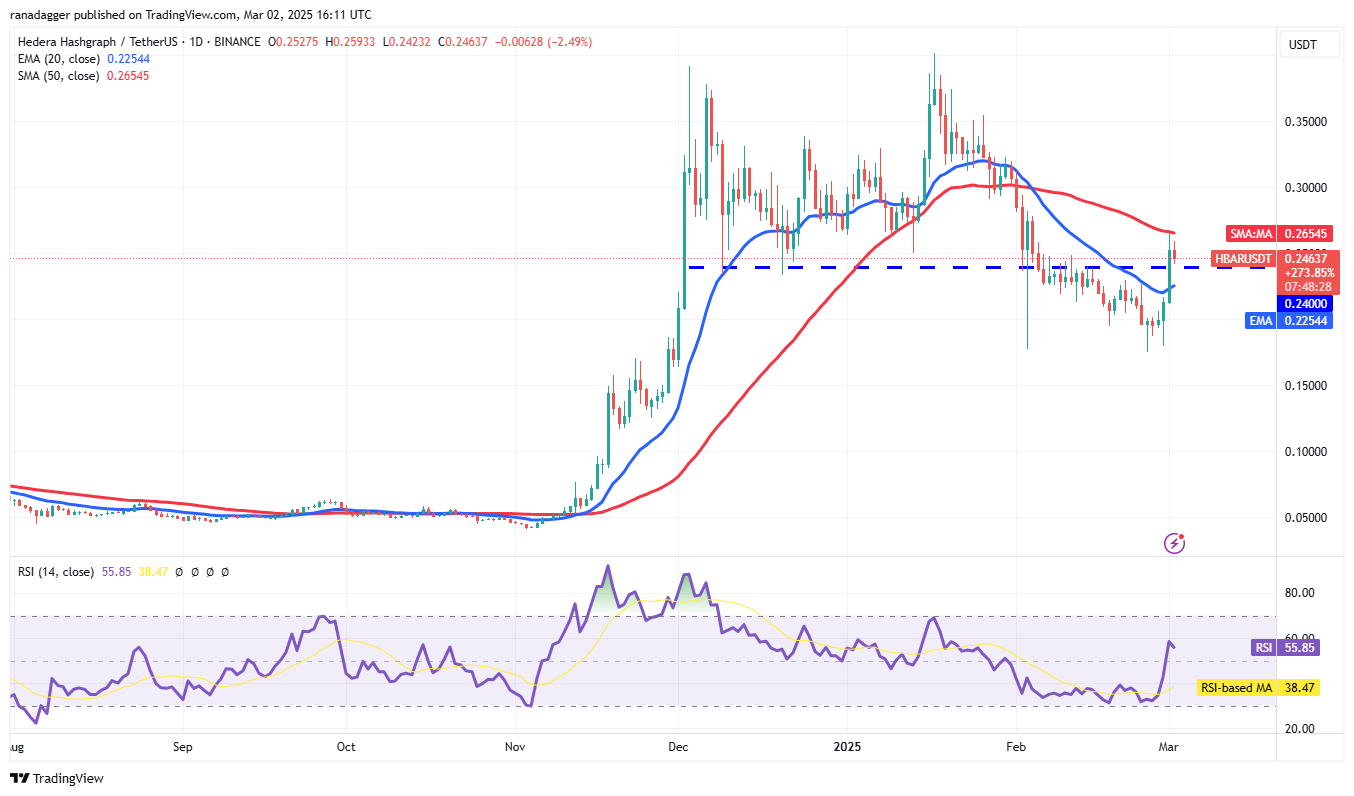
HBAR/USDT daily chart. Source: Cryptox/TradingView
The 20-day EMA is the critical support to watch out for on the downside. If the price rebounds off the 20-day EMA, it will signal a change in sentiment from selling on rallies to buying on dips. The bulls will again try to propel the HBAR/USDT pair above the 50-day SMA. If they can pull it off, the pair may rise to $0.32.
Contrarily, a break and close below the 20-day EMA suggests that the bears remain sellers on rallies. The pair may slump to $0.18, where the bulls will try to arrest the decline.
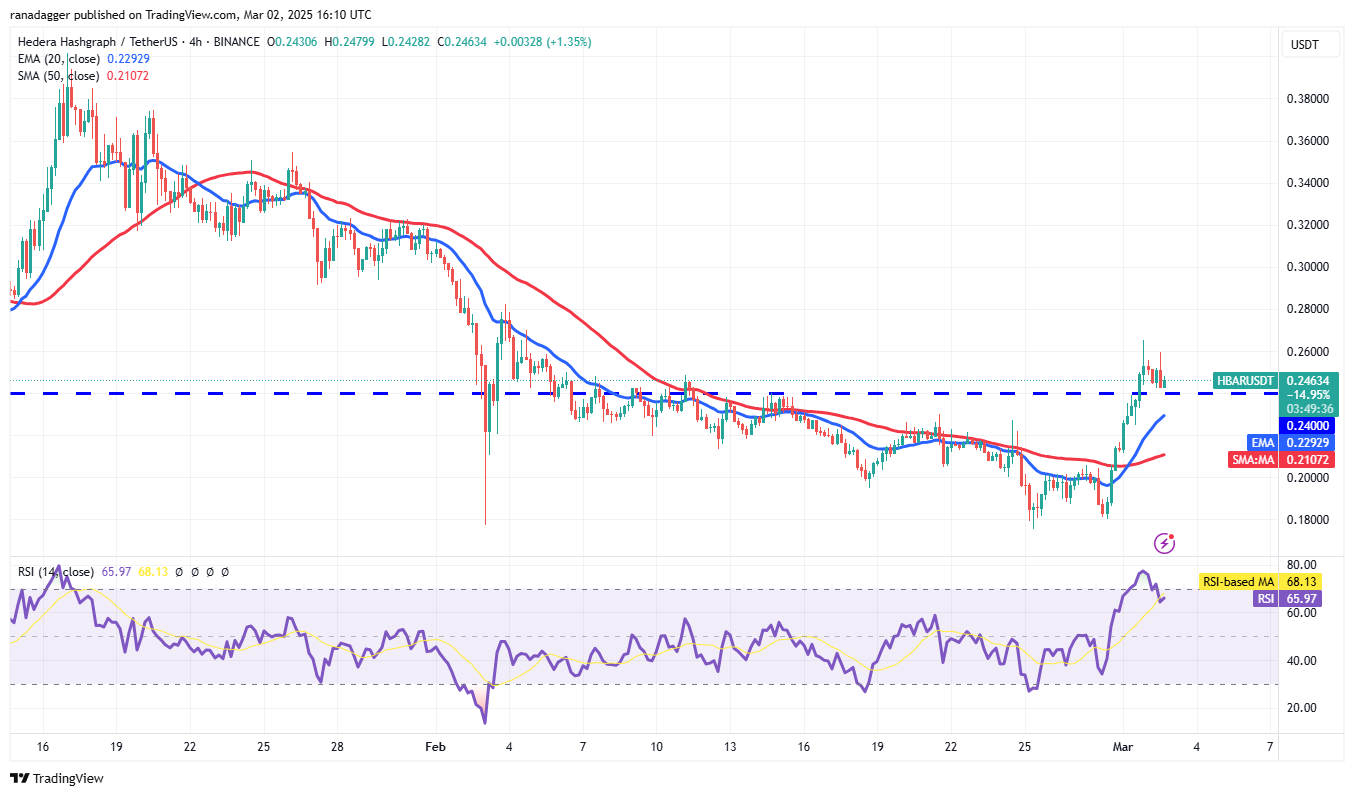
HBAR/USDT 4-hour chart. Source: Cryptox/TradingView
The pair turned down from $0.26 but is likely to find support at the 20-EMA on the 4-hour chart. If the price rebounds off the 20-EMA with force, it will signal buying on dips. That improves the prospects of a rally to $0.28.
Instead, if the price continues lower and breaks below the 20-EMA, it will suggest that the bulls are losing their grip. The pair may tumble to the 50-SMA, which is likely to act as strong support.
Litecoin price analysis
Litecoin (LTC) has been trading inside a symmetrical triangle pattern, indicating indecision between the buyers and sellers.

LTC/USDT daily chart. Source: Cryptox/TradingView
The flattish 20-day EMA ($122) and the RSI near the midpoint do not give a clear advantage either to the bulls or the bears. If the price rises and sustains above the 20-day EMA, the bulls will try to push the LTC/USDT pair above the resistance line. If they succeed, the pair may rise to $147.
Contrarily, a close below the moving averages suggests that the short-term advantage has tilted in favor of the bears. The pair may skid to the support line, which is a crucial level for the bulls to defend because a break below it may sink the pair to $86.
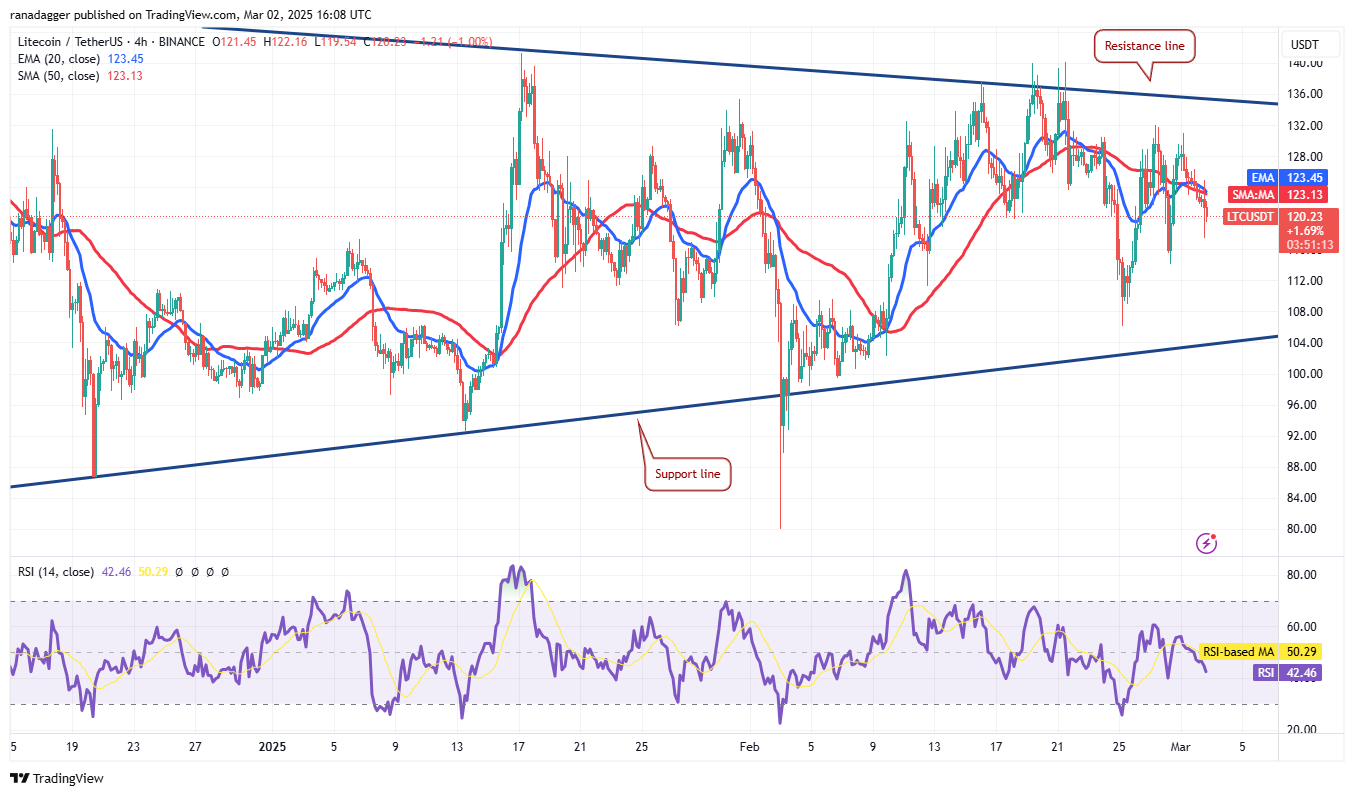
LTC/USDT 4-hour chart. Source: Cryptox/TradingView
The pair has dipped below the moving averages on the 4-hour chart, indicating that the bears are trying to take charge. If the price sustains below the moving averages, the pair could descend to $114 and then to the support line.
Buyers will have to push and maintain the price above the moving averages to open the doors for a rise to $132 and later to the resistance line. The up move could pick up momentum after the price closes above the resistance line.
Related: Here’s what happened in crypto today
Monero price analysis
Monero (XMR) bounced off the $205 level and rose above the moving averages, signaling solid buying on dips.
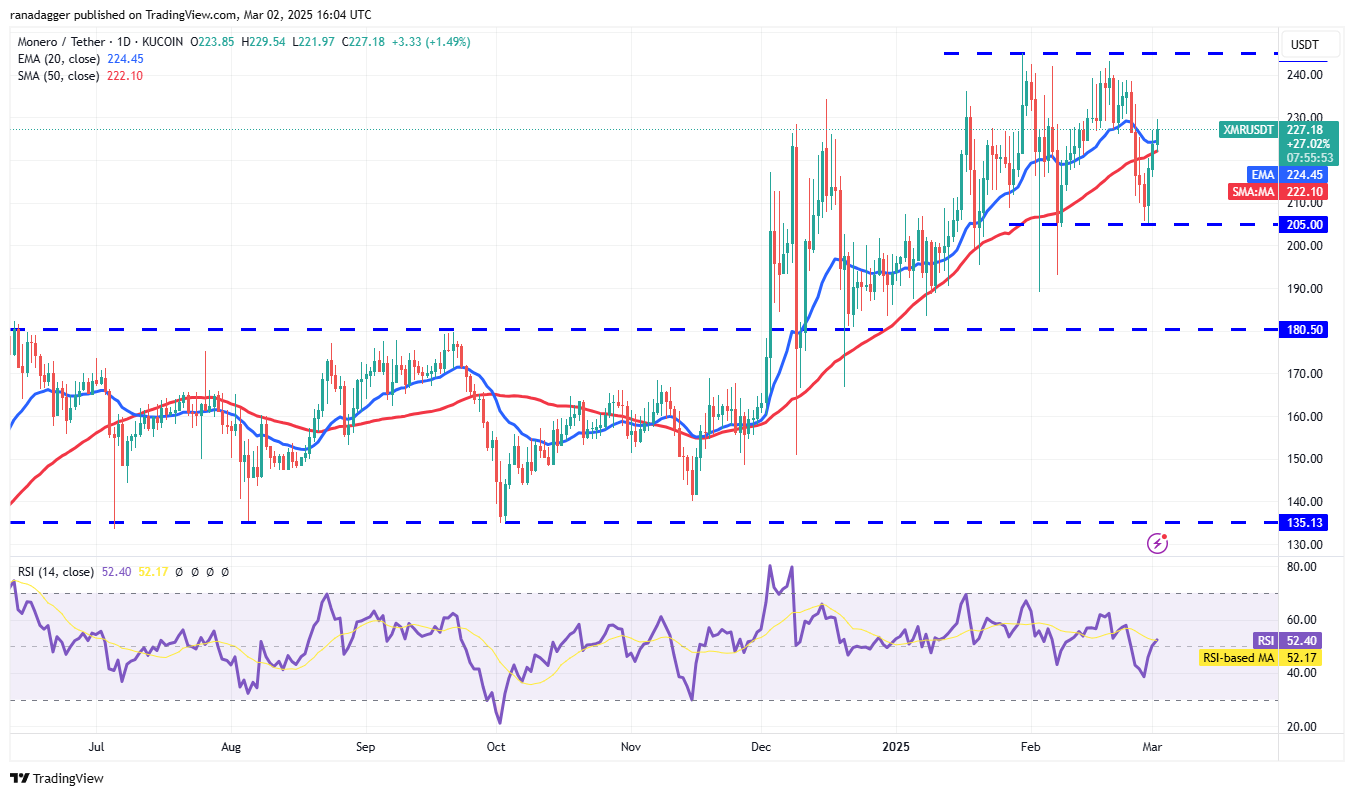
XMR/USDT daily chart. Source: Cryptox/TradingView
The flattish 20-day EMA ($224) and the RSI near the midpoint suggest that the XMR/USDT pair may swing between $205 and $245 for a few days. If the price stays above the 20-day EMA, the pair could retest the $245 resistance.
On the contrary, if buyers fail to maintain the price above the moving averages, it will suggest a lack of demand at higher levels. The bears will then try to pull the price down to the support of the range at $205.
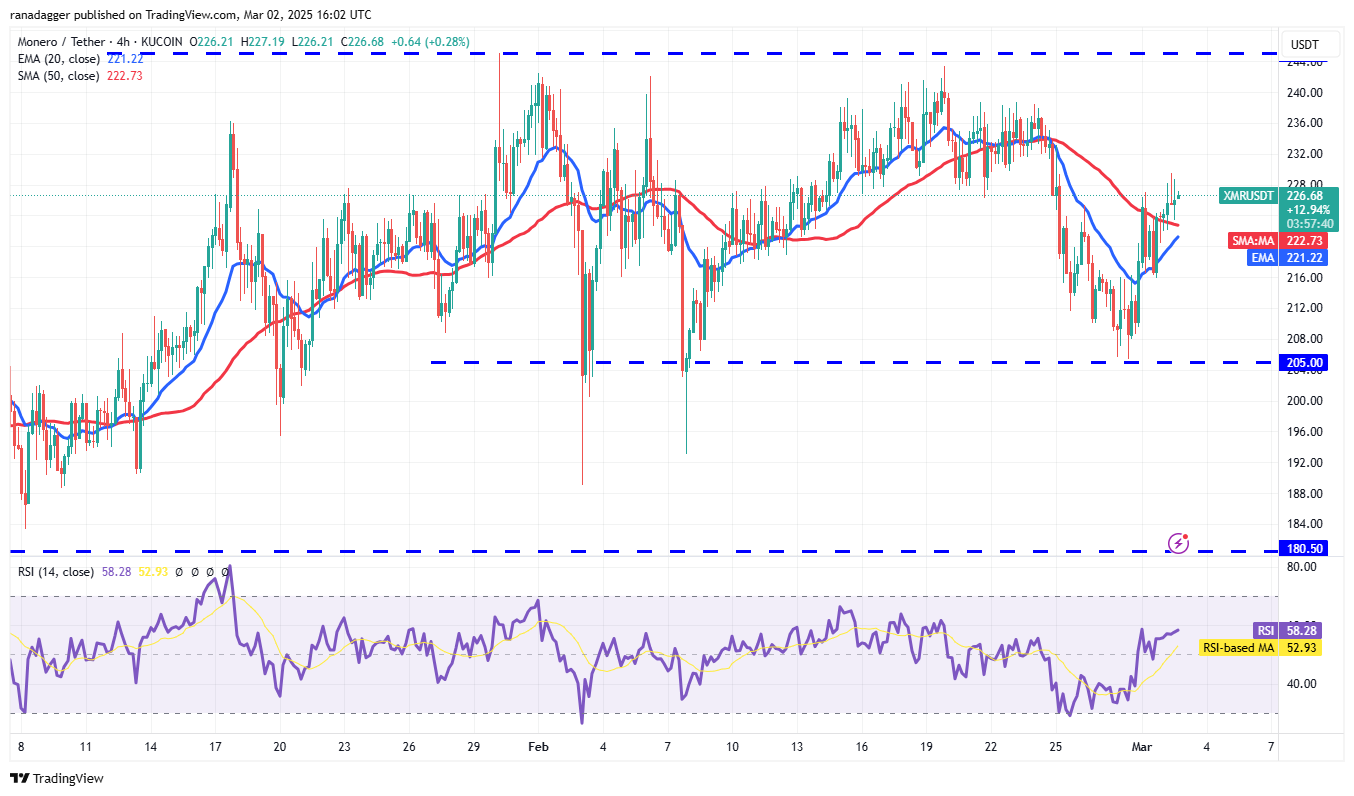
XMR/USDT 4-hour chart. Source: Cryptox/TradingView
The 20-EMA has started to turn up on the 4-hour chart, and the RSI is in the positive zone, indicating an advantage to buyers. The pair could rise to $238, where the bears are expected to step in.
On the downside, a break and close below the 20-EMA suggests that the bears are back in the game. The pair may slide to $216, and if this level cracks, the next stop could be the solid support at $205.
Celestia price analysis
Celestia (TIA) has risen above the moving averages, and the bulls are trying to sustain the price above the breakdown level of $4.14.

TIA/USDT daily chart. Source: Cryptox/TradingView
If they manage to do that, it will signal that the markets have rejected the breakdown. There is minor resistance at $4.50, but if the level is crossed, the TIA/USDT pair could climb to $5.50. Sellers are expected to defend the $5.50 level aggressively.
This positive view will be invalidated in the near term if the price turns down and breaks below the 20-day EMA ($3.66). That could sink the pair to $3 and subsequently to $2.72. Such a move will suggest that the bears have flipped the $4.14 level into resistance.
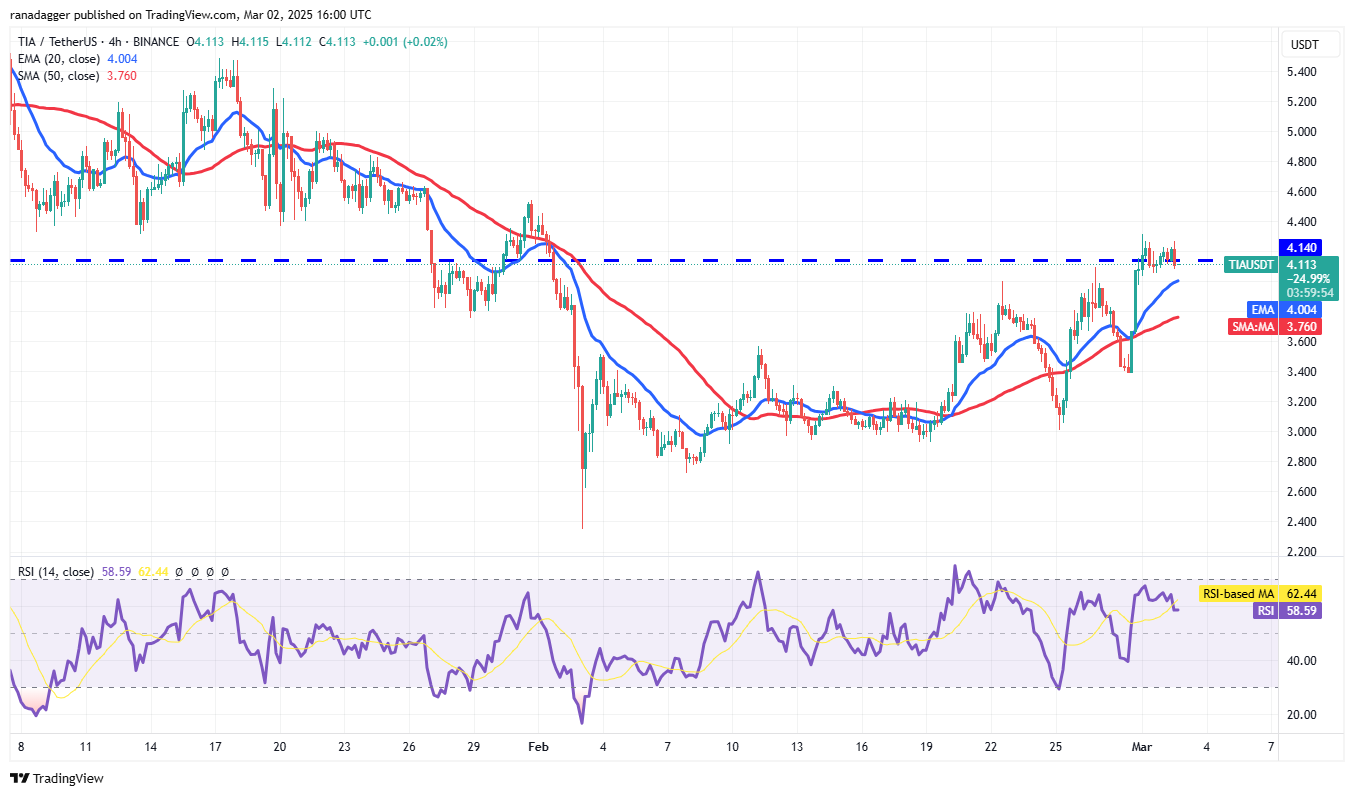
TIA/USDT 4-hour chart. Source: Cryptox/TradingView
Both moving averages have started to turn up, and the RSI is in the positive territory on the 4-hour chart, indicating an advantage to buyers. The first sign of weakness will be a break and close below the moving averages. If that happens, the pair could drop to $3.40 and later to $3.
If buyers want to retain the advantage, they will have to defend the 20-EMA and quickly push the price above $4.31. The $4.50 level may prove to be a stiff resistance, but if the buyers overcome it, the pair could jump to $5.
This article does not contain investment advice or recommendations. Every investment and trading move involves risk, and readers should conduct their own research when making a decision.


