Following a gain of over 25% on Friday, NEAR dropped by over 10% to start the weekend, while XMR rose to a four-month high. The move in NEAR comes as traders look to be taking profits from recent highs, and as market uncertainty remains high.
Near Protocol (NEAR)
After being Friday’s biggest gainer, climbing by over 25%, NEAR was trading lower to start the weekend.
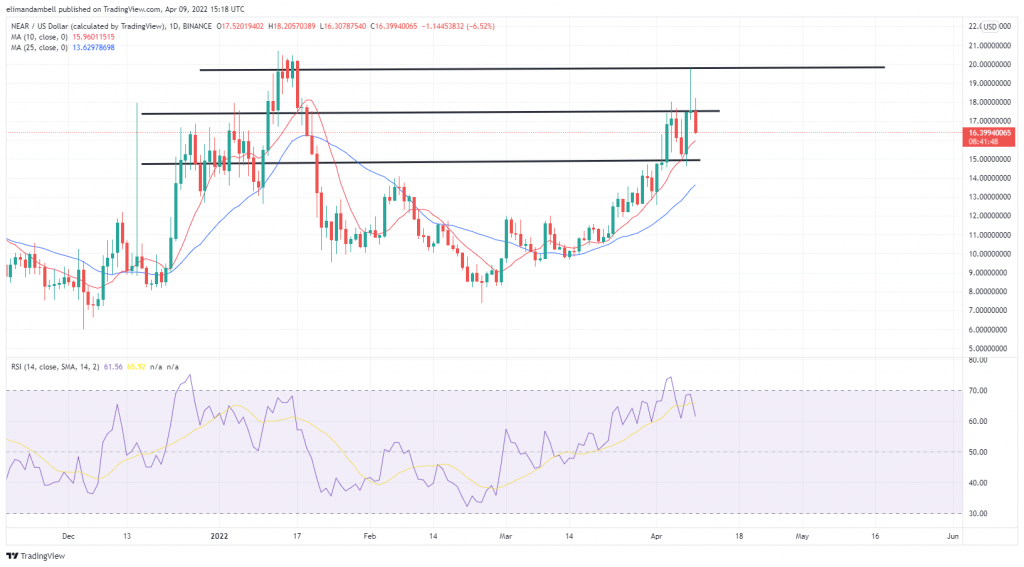
NEAR/USD fell to an intraday low of $16.39 during today’s session, as bullish sentiment in the world’s nineteenth-largest cryptocurrency began to fade.
This drop follows on from a top of $19.45 less than 24 hours ago, which came after speculation grew that Near Protocol would create a stablecoin that would rival the likes of Terra’s UST.

Looking at the chart, yesterday’s peak was close to resistance of $20, and traders likely dumped NEAR as price uncertainty emerged at that level .
Today’s selloff has now sent prices below short-term support at $17.50, with some bears likely targeting the lower support of $15 in the next few sessions.
Price strength is still relatively overbought, and is currently tracking at 62.30, which could be yet another signal to bears looking to enter the market.
Monero (XMR)
Despite crypto markets falling by over 2% during today’s session, XMR was one of the few to trade in the green.
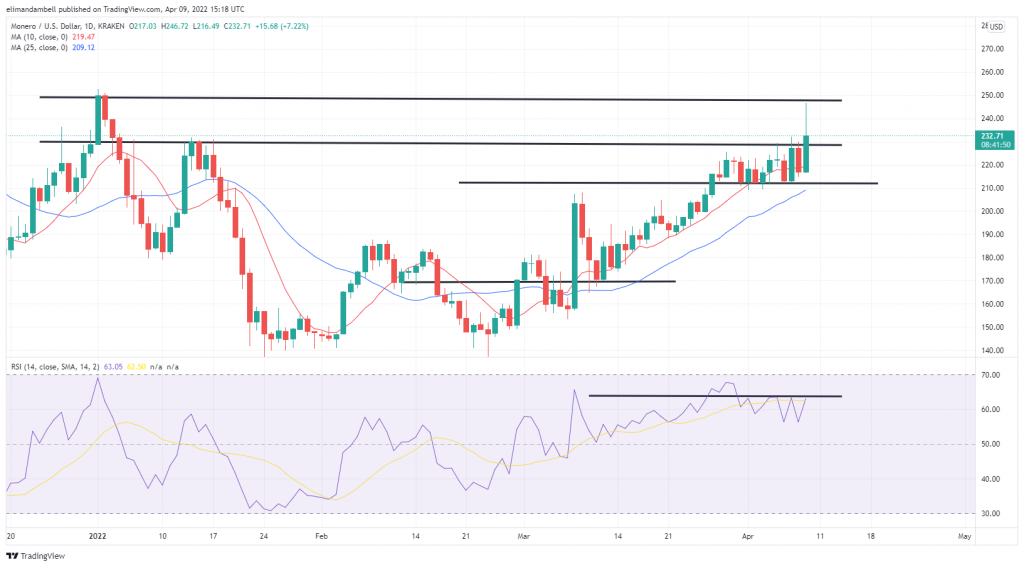
Following a low of $215.28 during Friday’s session, XMR/USD rose to an intraday high of $237.81 on Saturday.
This rebound in price came after prices failed to break out of the $212 support, with bulls seeing this as a sign to buy the dip.

Saturday’s surge came as XMR rose past its long-term resistance level of $228.55, on its way to its highest point in over four months.
As seen on the chart, today’s gains have somewhat eased, in a similar fashion to the move in early January, as traders likely secured profits.
The 14-day RSI is now sitting below a key resistance level of 63.69, and until this point is breached, we may not see any further gains in price.
Is there enough bullish momentum to overcome this hurdle? Let us know your thoughts in the comments.
Image Credits: Shutterstock, Pixabay, Wiki Commons
Disclaimer: This article is for informational purposes only. It is not a direct offer or solicitation of an offer to buy or sell, or a recommendation or endorsement of any products, services, or companies. Cryptox.trade does not provide investment, tax, legal, or accounting advice. Neither the company nor the author is responsible, directly or indirectly, for any damage or loss caused or alleged to be caused by or in connection with the use of or reliance on any content, goods or services mentioned in this article.


