

Key points:
-
Bitcoin risks falling to $110,530, where the buyers are expected to step in.
-
Bitcoin is approaching a solid support, and a strong rebound off it could see buyers return to ETH, BNB, LINK, and MNT.
Bitcoin (BTC) is gradually pulling lower, indicating profit booking by short-term traders. Bitfinex analysts said in a report on Monday that BTC could remain range-bound until stronger macro catalysts emerge as investors remain in a wait-and-watch mode.
While some analysts expect BTC to drop toward $100,000, X analyst BitQuant thinks otherwise. He said BTC remains on target to soar to $145,000 and would not even come close to $100,000.
BTC’s near-term uncertainty has put the brakes on the rallies of several altcoins, including Ether (ETH). Spot ETH exchange-traded funds recorded $196.7 million in outflows, the second-largest daily outflow since launch, according to SoSoValue data.
Unfazed by the dip, trader Merlijn said in a post on X that ETH could surge above $8,000, terming it “a new chapter” in ETH’s history.
If BTC rebounds off the support, select altcoins could surprise to the upside. Let’s analyze the charts of the top 5 cryptocurrencies that look strong on the charts in the near term.
Bitcoin price prediction
BTC bounced off the neckline of the inverse head-and-shoulders pattern on Monday, but the bulls could not clear the overhead hurdle at the 20-day exponential moving average ($117,032).
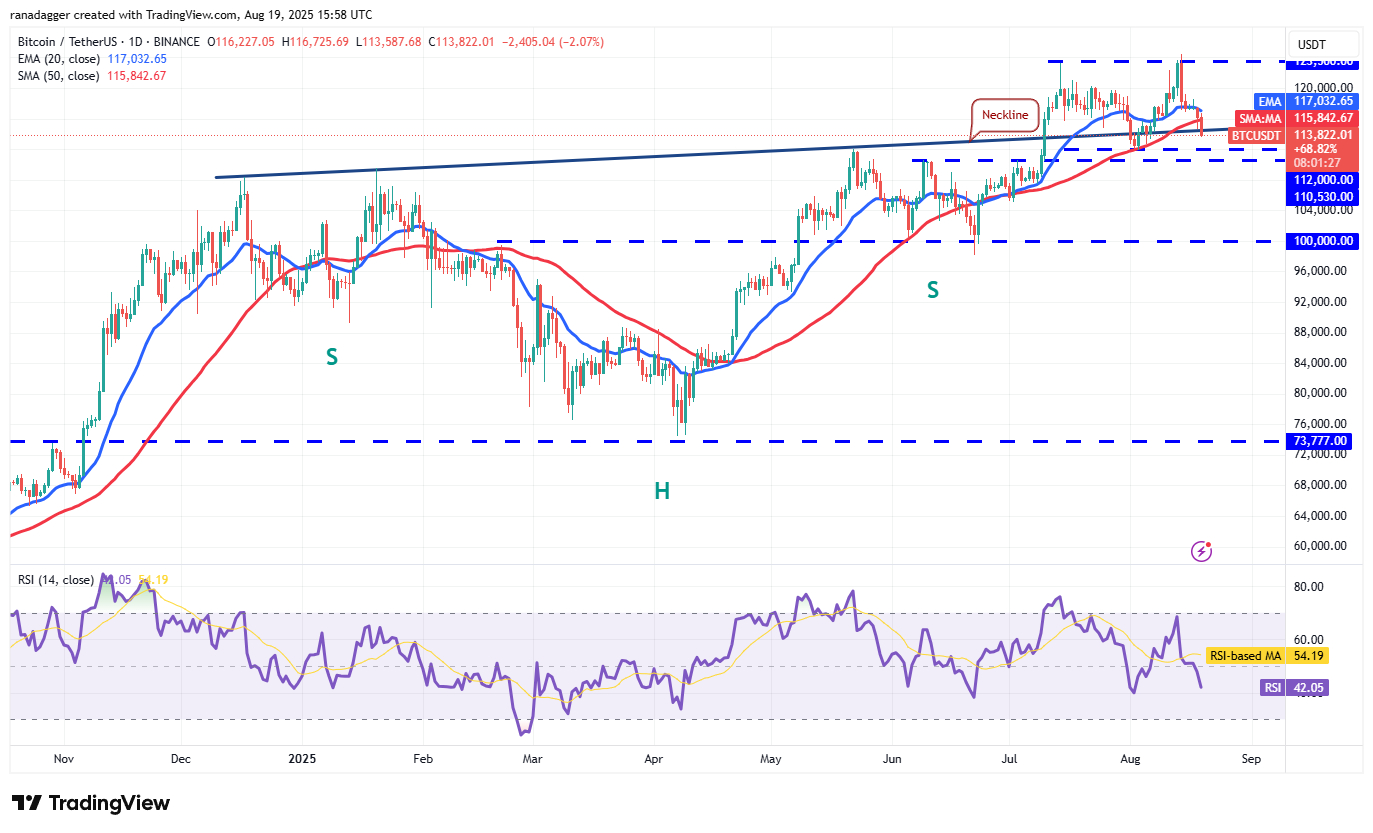
The bears resumed selling on Tuesday and are trying to maintain the price below the neckline. If they manage to do that, the BTC/USDT pair could plummet to solid support at $110,530. Buyers are expected to fiercely defend the $110,530 level because a break below it could accelerate selling. The Bitcoin price may then skid toward $100,000.
The first sign of strength will be a break and close above the 20-day EMA. That suggests the selling pressure is reducing. The pair may then climb to $120,000 and eventually to the all-time high of $124,474.
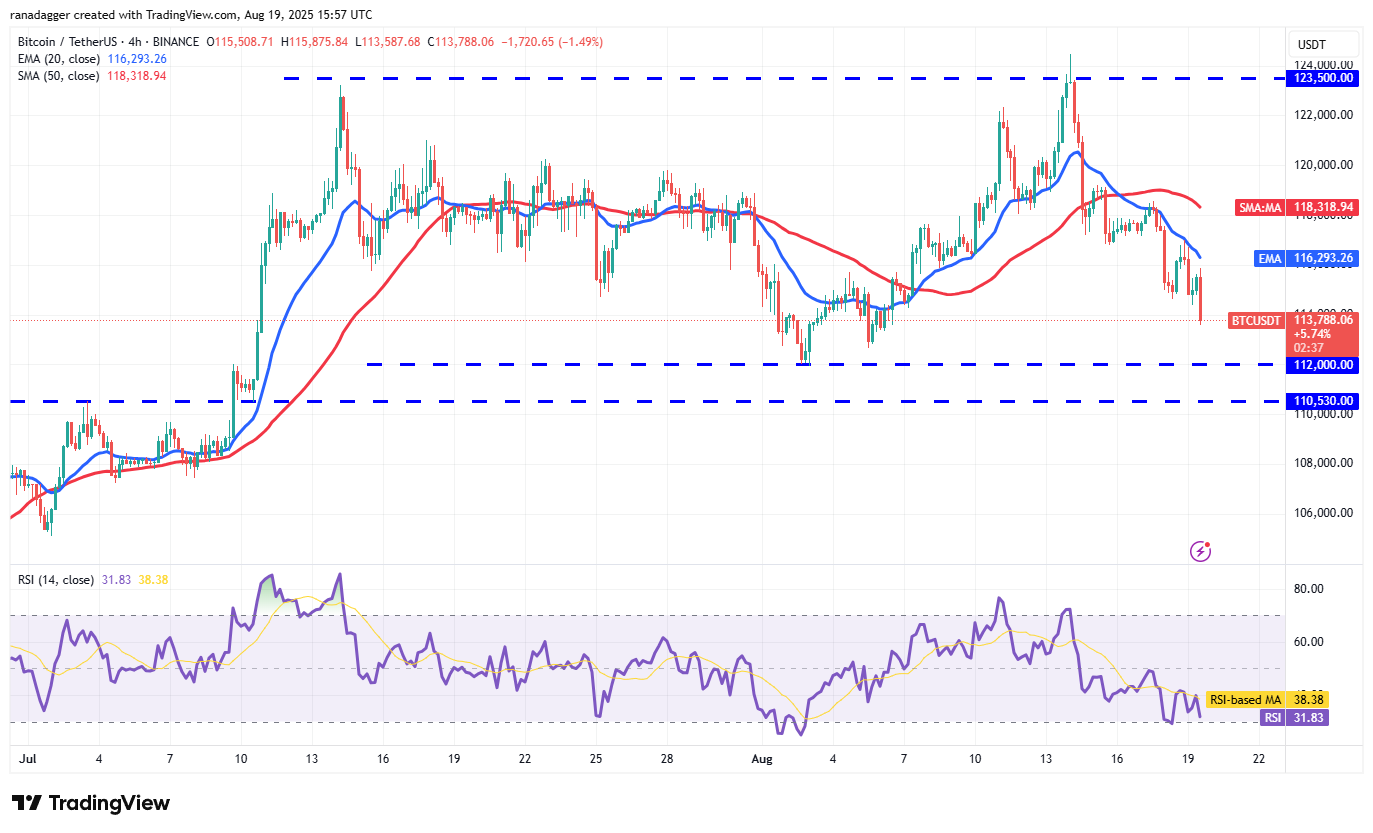
The 20-EMA is sloping down, and the relative strength index (RSI) is in the negative territory on the 4-hour chart. That suggests the bears have the upper hand in the near term. The Bitcoin price could skid to $112,000, which is likely to act as strong support. If the price rebounds off $112,000 and breaks above the moving averages, the pair could form a range in the short term.
Sellers will have to yank the price below the $112,000 to $110,530 support zone to deepen the correction. The pair may slump to $107,000 and then to $105,000.
Ether price prediction
Ether has pulled back to the breakout level of $4,094, which is a critical level to watch out for in the near term.
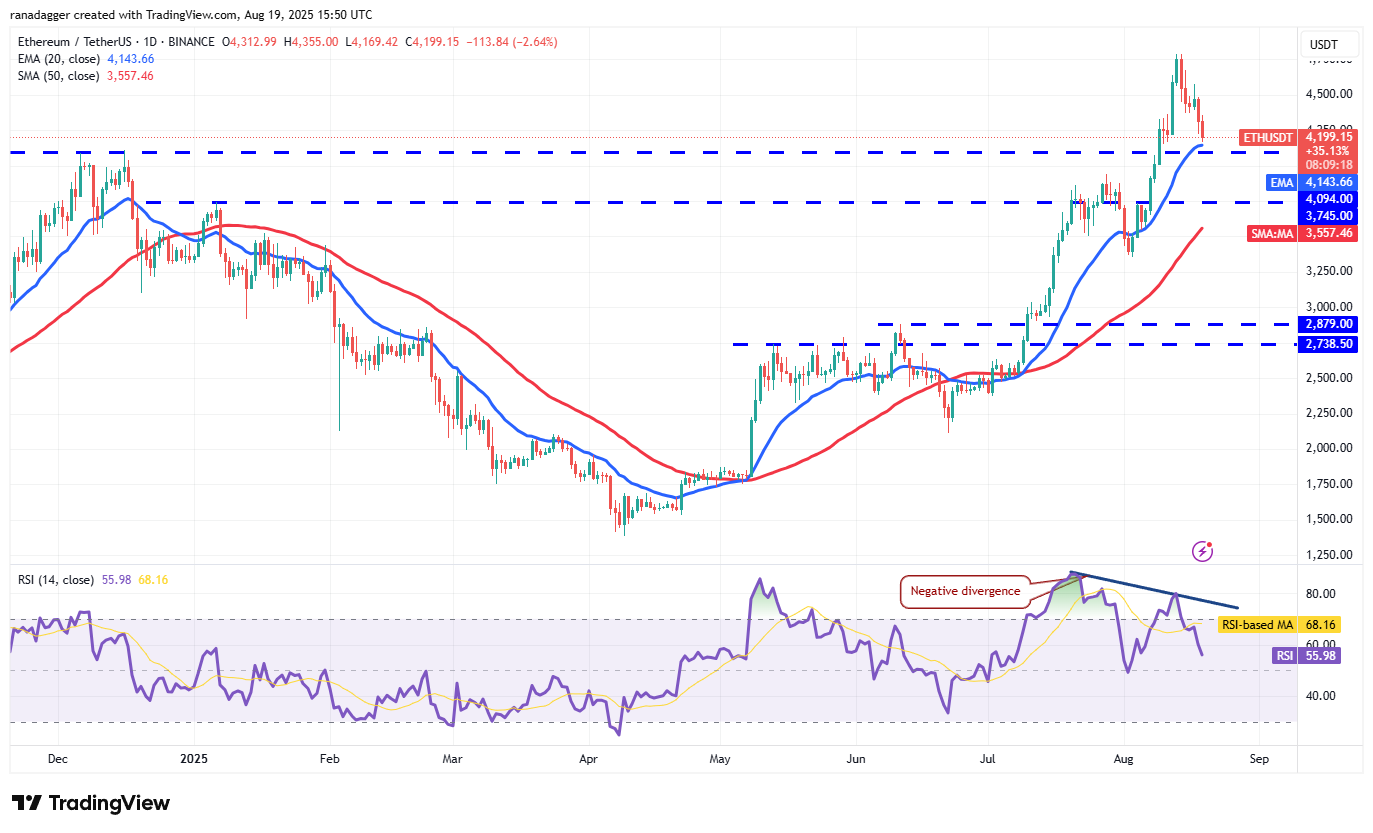
The upsloping moving averages indicate advantage to buyers, but the negative divergence on the RSI suggests the bullish momentum is weakening. If the price rebounds off $4,094, the ETH/USDT pair could rise to $4,576 and then to $4,788.
Instead, if the price continues lower and breaks below $4,094, it signals that bulls are rushing to the exit. That could sink the Ether price to $3,745 and subsequently to the 50-day simple moving average ($3,557).
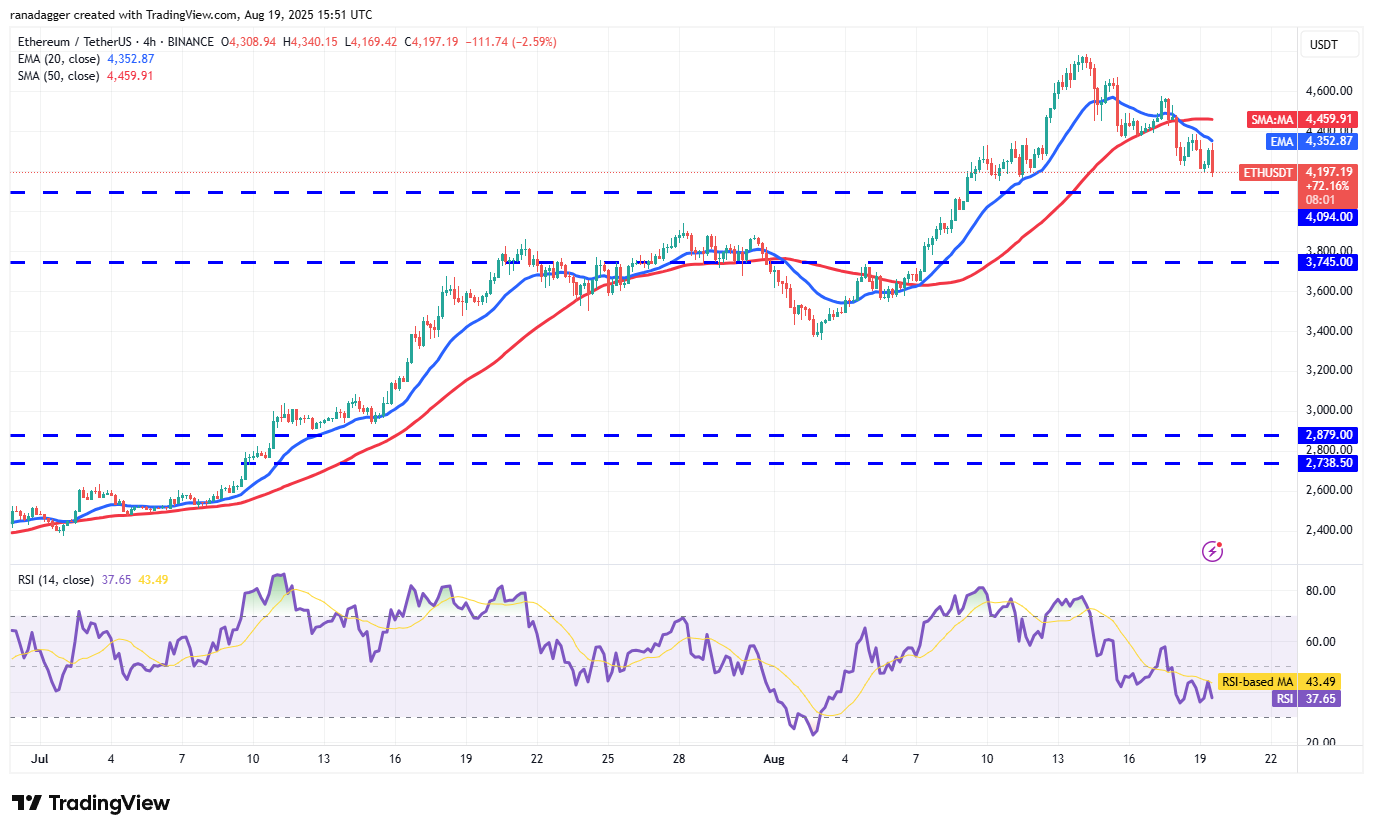
The moving averages have completed a bearish crossover, and the RSI has dipped into the negative territory on the 4-hour chart, signaling that the bears are attempting a comeback. A break and close below $4,094 could intensify selling, pulling Ether’s price to $3,875 and, after that, to $3,550.
On the contrary, if the price rebounds off $4,094 and breaks above the 50-SMA, it suggests that the correction may be over. The pair may then rally to $4,576.
BNB price prediction
BNB (BNB) is facing resistance in the $861 to $869 zone, but a positive sign is that the bulls have not ceded much ground to the bears.
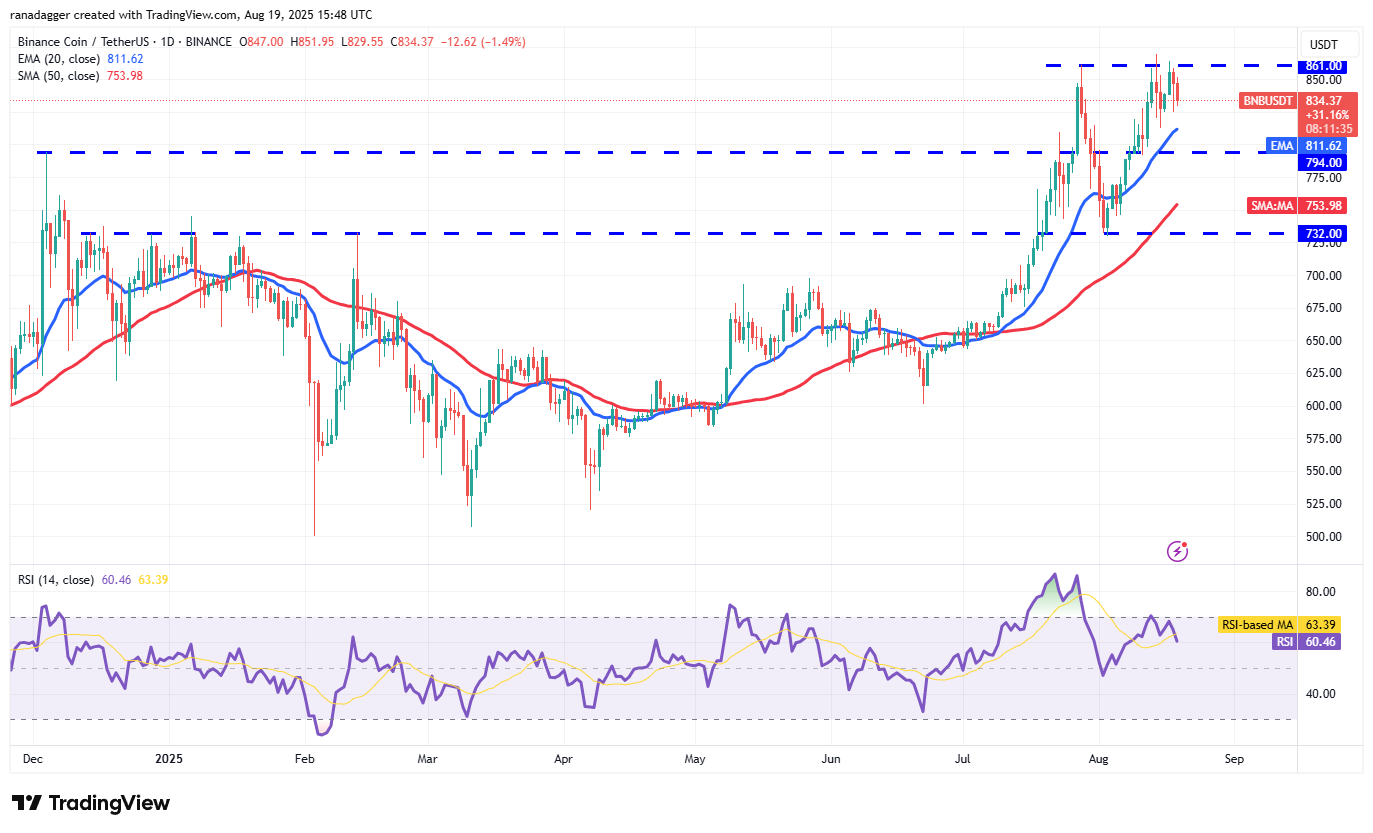
A shallow pullback enhances the prospects of a break above the overhead zone. If that happens, the BNB price could resume the uptrend to $900 and subsequently to the psychological level of $1,000.
Sellers are likely to have other plans. They will strive to pull the price below the 20-day EMA ($811). If they do that, the BNB/USDT pair could form a range in the near term. The BNB price could swing between $732 and $869 for a while.
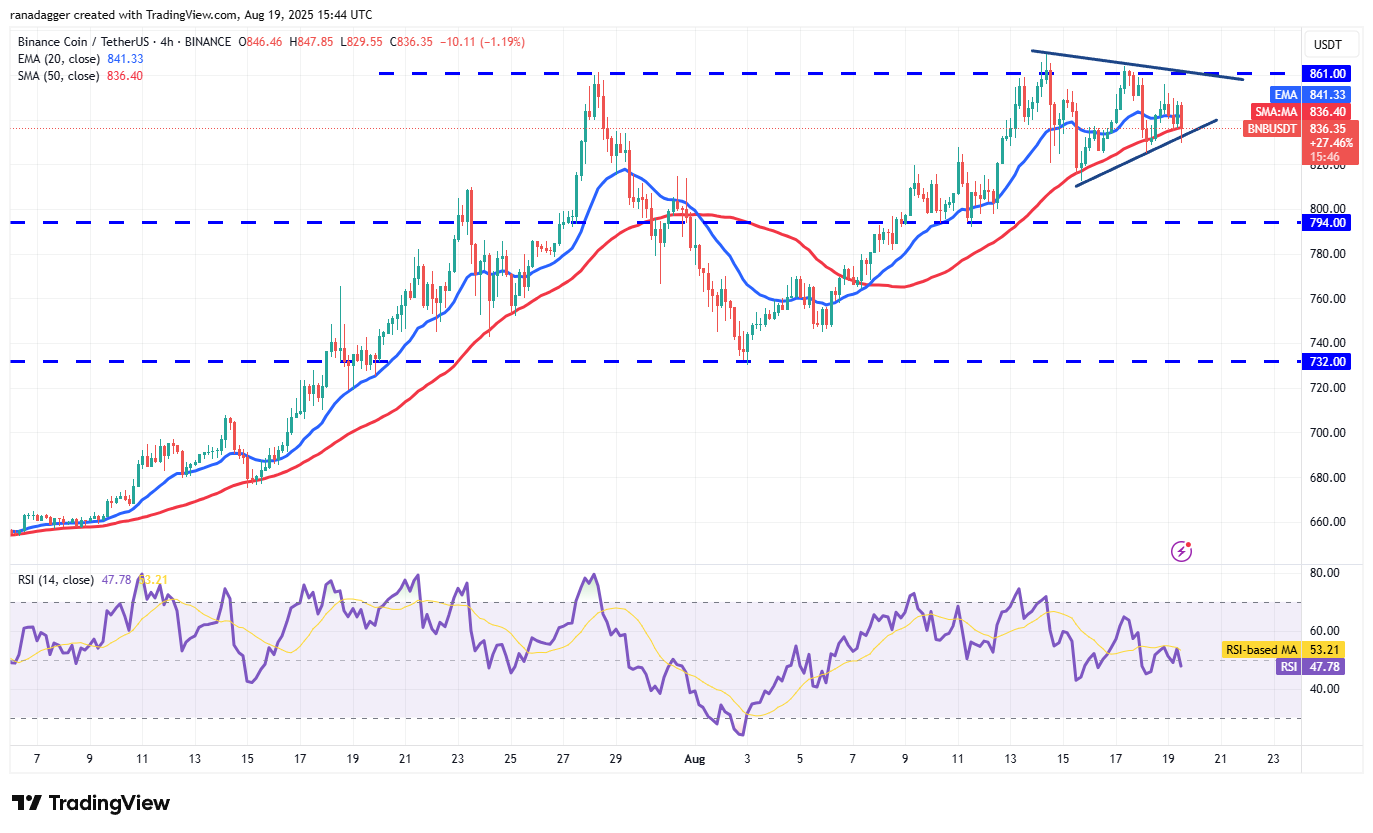
The BNB price has formed a symmetrical triangle pattern on the 4-hour chart, indicating indecision between the bulls and the bears. A break and close above the triangle shows that the buyers have overpowered the sellers. That opens the doors for a possible rally to the pattern target of $918.
Contrary to this assumption, a drop below the triangle could start a deeper correction to $812 and then to $794.
Related: Cardano set for ‘massive’ rally if $1 breaks: How high can ADA price go?
Chainlink price prediction
Chainlink (LINK) turned down from the $27 overhead resistance on Monday, indicating profit booking by short-term bulls.
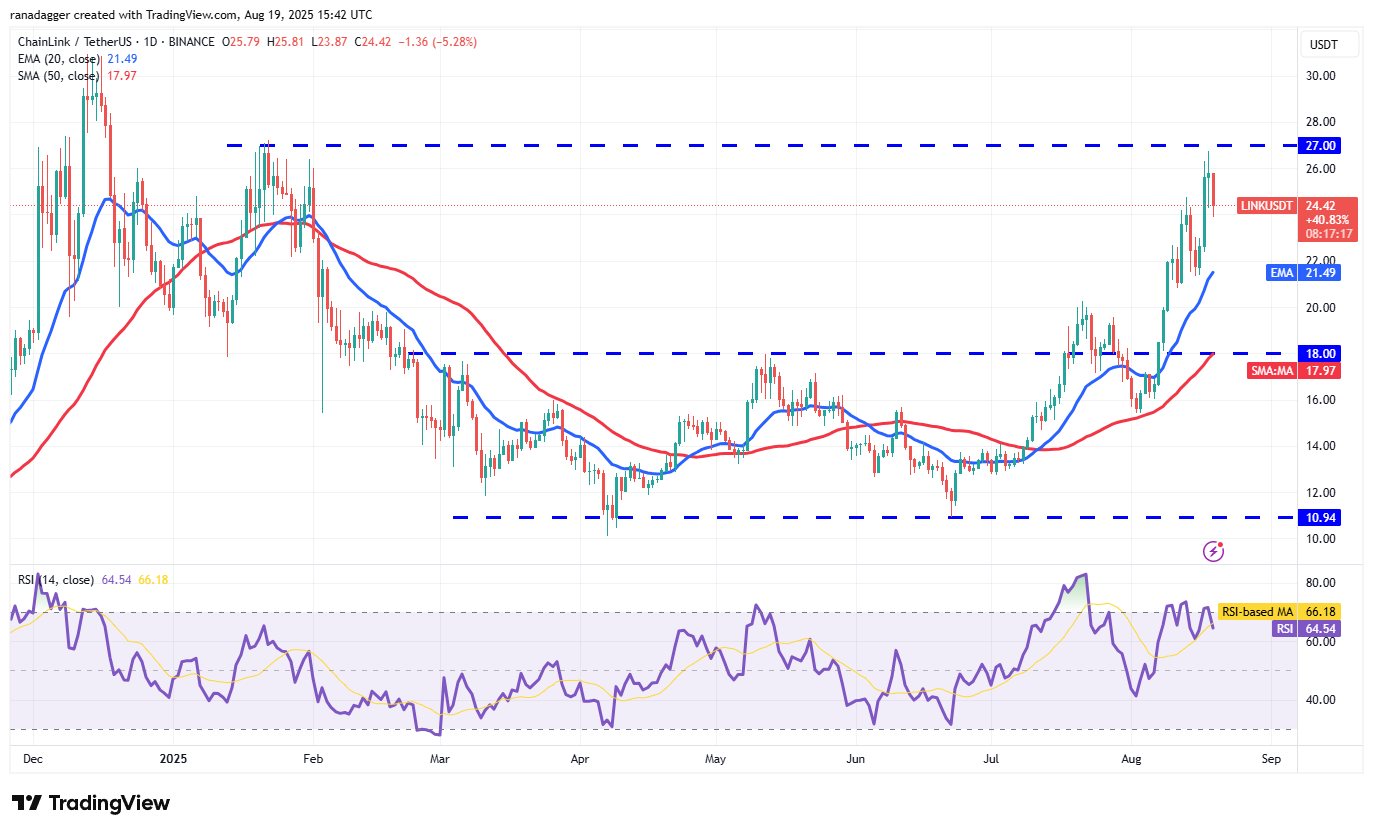
The first support is at $24 and then at the 20-day EMA ($21.49). A solid rebound off the 20-day EMA signals buying on dips. The bulls will then make one more attempt to overcome the barrier at $27. If they succeed, the LINK/USDT pair could surge to $31 and thereafter to $36.
Contrarily, if the price turns down and breaks below the 20-day EMA, it suggests that the bulls are losing their grip. The Chainlink price could tumble toward the 50-day SMA ($17.97), where the bulls are expected to step in.
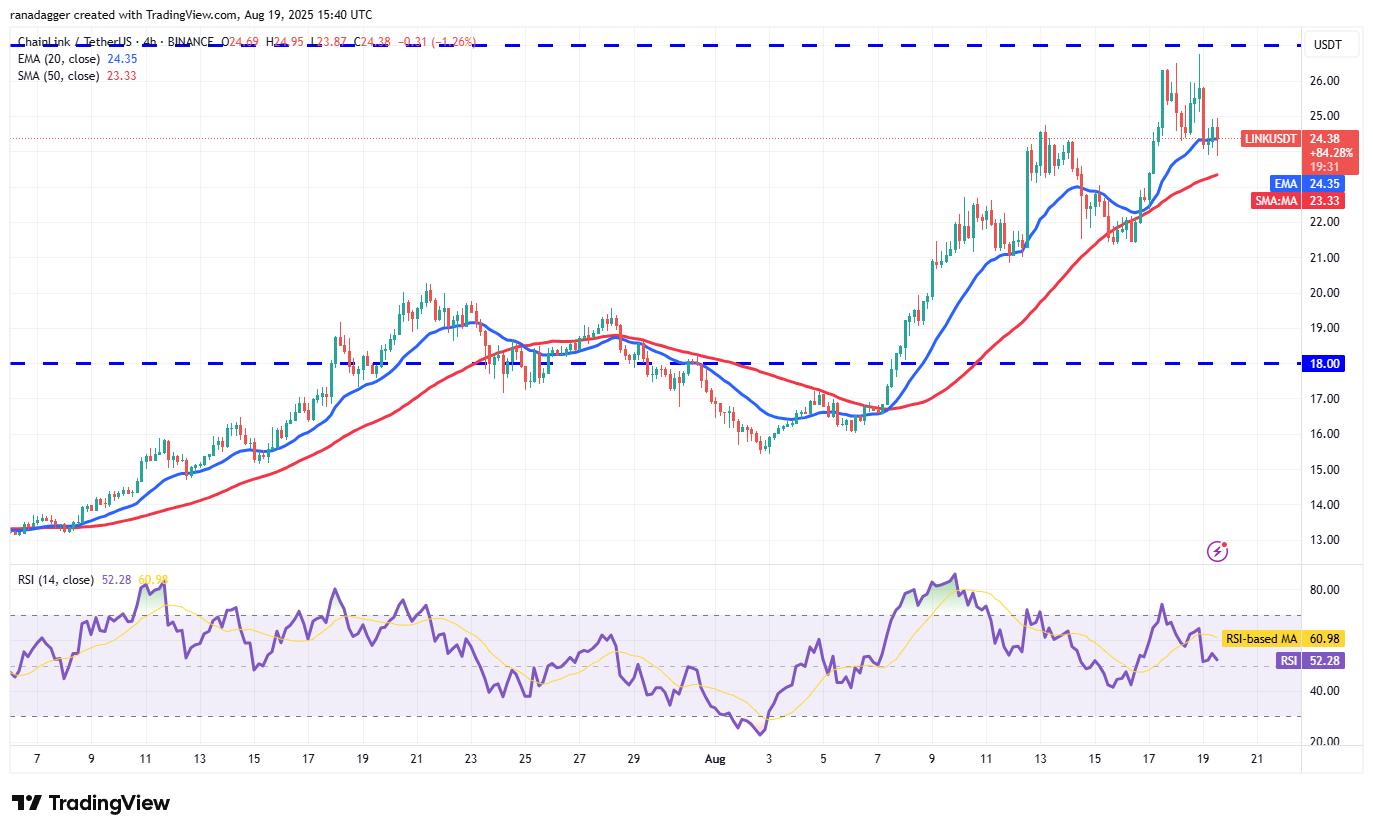
The bulls are trying to arrest the pullback at the moving averages on the 4-hour chart. If the price rebounds off the moving averages with strength, the pair could retest the overhead resistance at $27. A break and close above $27 signals the resumption of the uptrend.
This positive view will be invalidated in the near term if the price turns down and breaks below the 50-SMA. The Chainlink price could then descend to $21, which is a critical level to watch out for.
Mantle price prediction
Mantle (MNT) has rallied sharply in the past few days, indicating aggressive buying by the bulls.
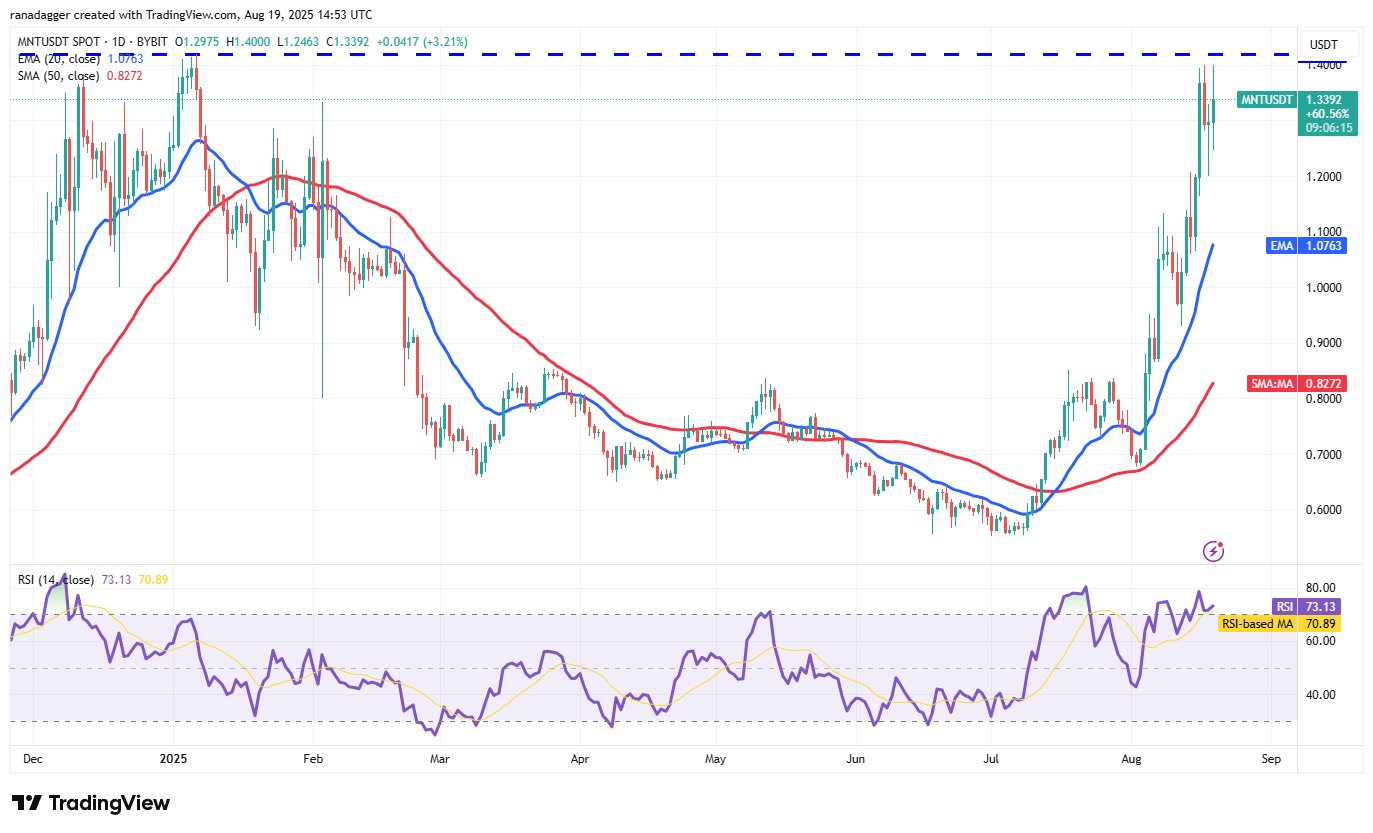
The bears tried to halt the rally at $1.42, but they could not pull the price below $1.20. That suggests a positive sentiment where every dip is viewed as a buying opportunity. The bulls are trying to resume the uptrend by pushing the price above $1.42. If they can pull it off, the MNT/USDT pair could soar to $1.67. There is resistance at $1.51, but it is likely to be crossed.
Alternatively, if the price turns down sharply from $1.42 and breaks below $1.20, it signals that the bulls are closing their positions in a hurry. The Mantle price could then plummet to the 20-day EMA ($1.07).
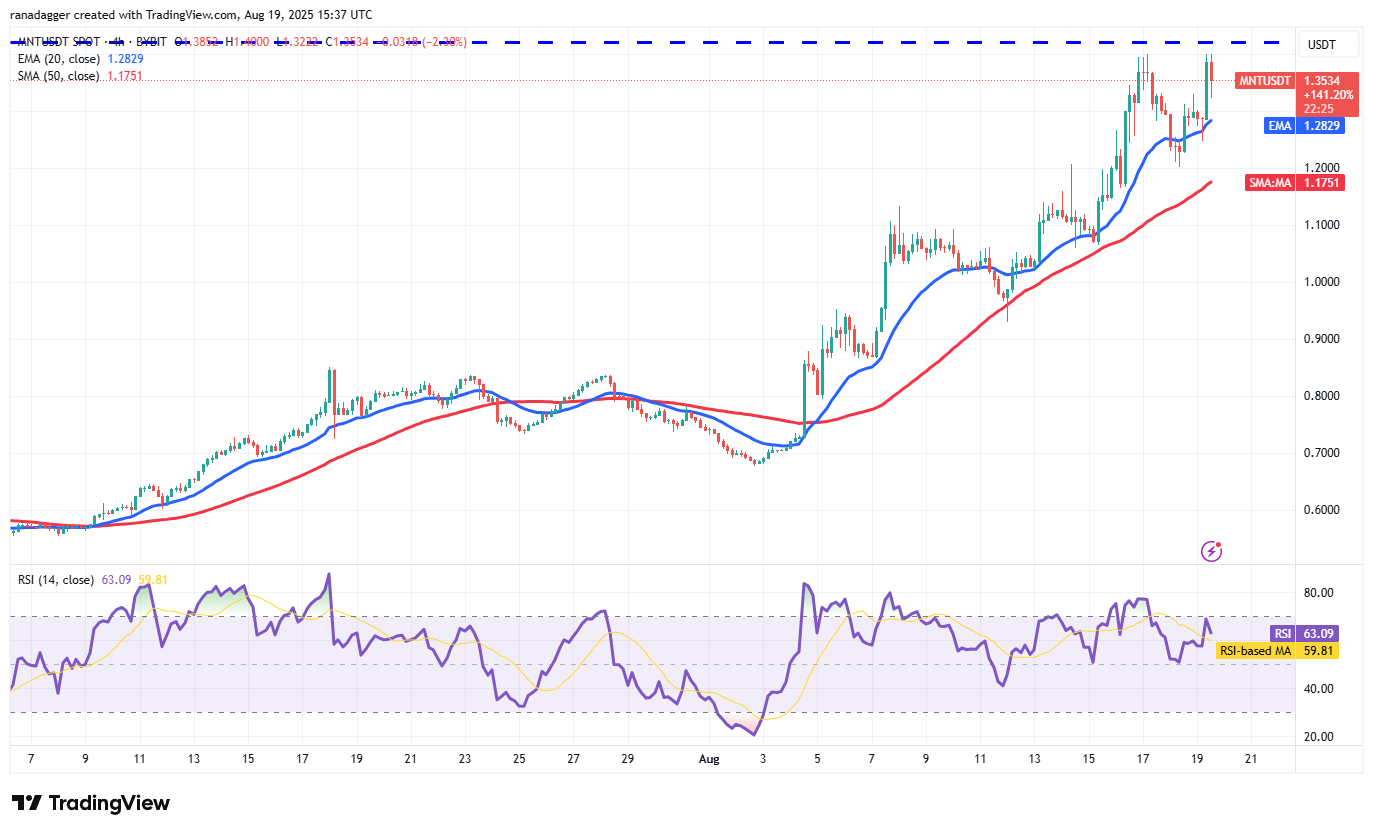
The pair turned up from the 20-EMA on the 4-hour chart, but the recovery is facing selling at the overhead resistance of $1.42. If the price continues lower and breaks below the 20-EMA, the correction could stretch to the 50-SMA. A short-term trend change will be signaled if the 50-SMA support cracks. Mantle’s price could then slide to $1.06 and subsequently to $0.93.
On the contrary, if the price turns up and breaks above $1.42, the pair could start the next leg of the rally to $1.50.
This article does not contain investment advice or recommendations. Every investment and trading move involves risk, and readers should conduct their own research when making a decision.


