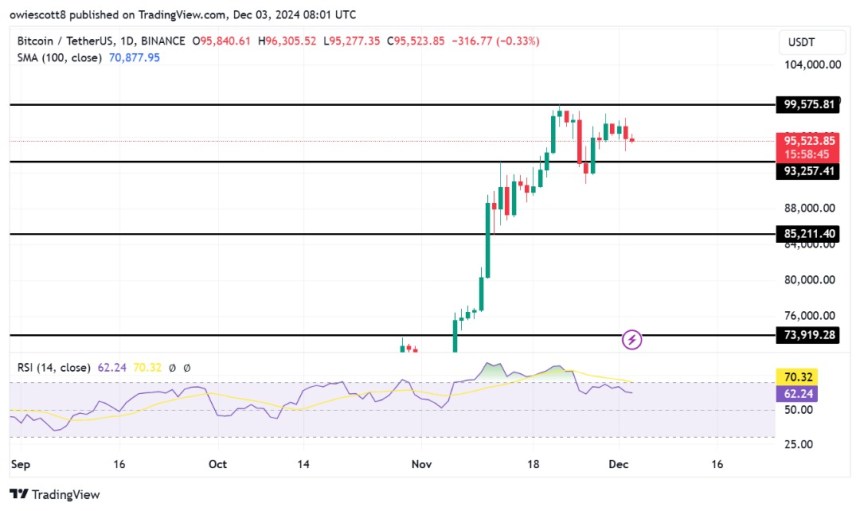
Bitcoin has started a fresh decline, approaching the crucial $93,257 support level that has proven to be a battleground for bulls lately. Thus, the question remains whether buyers can regain control and defend this level once more. As uncertainty looms, all eyes are on this critical zone, which could determine whether Bitcoin bounces back or faces a deeper downward trajectory.
With market volatility increasing, this article aims to delve into BTC’s renewed drop toward the $93,257 support level, assessing the likelihood of a bullish defense at this critical point. It examines technical patterns, market sentiment, and key levels to better gauge Bitcoin’s next price direction.
Bitcoin Slides Back Toward $93,257
On the 4-hour chart, BTC exhibits negative sentiment, attempting to drop below the 100-day Simple Moving Average (SMA) as it trends downward, with its sight set at the $93,257 support level. Furthermore, a continued descent to this support suggests that selling pressure is intensifying, and if the support fails to hold, the asset could experience more declines.
Also, an analysis of the 4-hour chart shows that the Relative Strength Index (RSI) is currently at 44%, following a failed attempt to break above the 50% mark. This indicates a struggle to sustain upward momentum and points to moderate bearish pressure, suggesting a cautious market sentiment. If the RSI continues to drop, it may signal heightened selling activity.
Related Reading
On the daily chart, the crypto giant displays significant downside movement, highlighted by bearish candlesticks after a failed recovery attempt to surge toward its previous high of $99,575. The inability to sustain the previous uptrend implies a lack of buyer confidence and a prevailing pessimistic sentiment in the market. As Bitcoin aims at the $93,257 support level, the pressure from sellers could intensify, raising concerns about the possibility of a breakdown.

Finally, the 1-day RSI indicates growing bearish momentum, with the signal line retreating to 62% from the overbought zone. This means that upside pressure is fading, and a shift in market sentiment may be underway. Given that the RSI continues to decline, it could signal a pullback or consolidation, with decreasing buying interest and the potential for bears to take control.
Market Sentiment: Bulls Vs. Bears At $93,257
Bitcoin is currently aiming for a retest of the critical $93,257 support level, setting the stage for a battle between bulls and bears. If the bulls manage to defend this key level, BTC could begin to rise again, aiming for its previous high of $99,575. A successful breakout above this level could pave the way for a new all-time high.
Related Reading
However, should the bears dominate at this support level, Bitcoin could continue its decline toward the $85,211 mark. A break below this level might trigger more downside, pushing the price toward additional support zones.
Featured image from Unsplash, chart from Tradingview.com


