

Key takeaways:
-
Ethereum ETF inflows reflect persistent demand from institutions.
-
ETH supply on exchanges hits 8-year low alongside rising whale accumulation.
-
MVRV price bands and V-shaped chart pattern hint at $4,000-$5,000 ETH price.
After an over 100% rally to $2,800 from multimonth lows below $1,400 in April, Ether’s (ETH) price has traded within a tight $400 range for almost 8 weeks. Despite this summer lull, multiple data points suggest that ETH price could still rally to $5,000 in 2025.
Strong spot Ethereum ETF flows
Ether’s ability to break out to new all-time highs has also been boosted by inflows into Ethereum-based investment products, suggesting persistent institutional demand.
Global Ethereum-based investment products continued their positive streak last week, with net inflows of $226.4 million, according to CoinShares. The products are now averaging 1.6% of assets under management in weekly inflows over 11 weeks, compared to Bitcoin’s 0.8%.
CoinShares head of research James Butterfill said:
“This highlights a notable shift in investor sentiment in favor of Ethereum.”
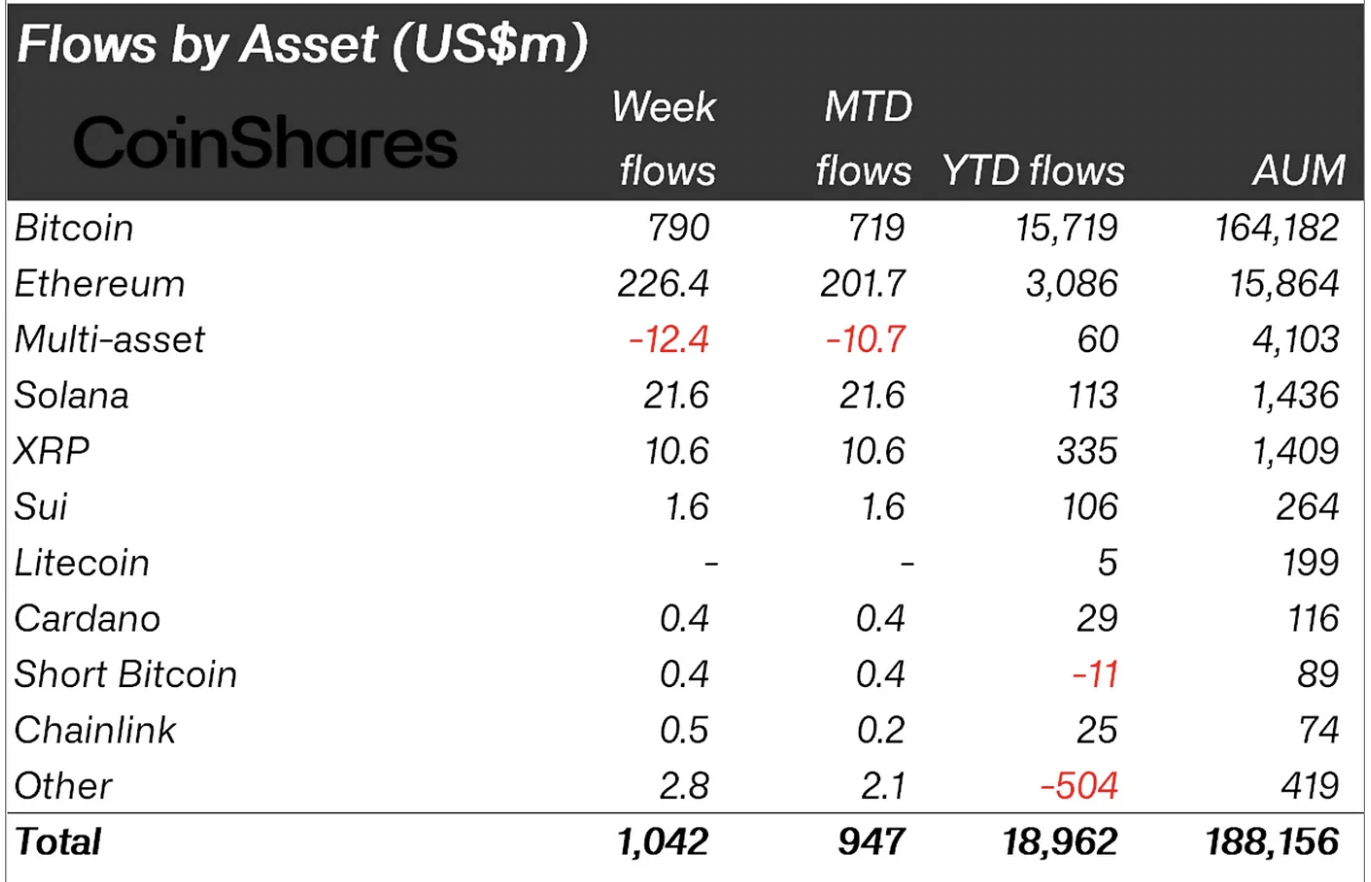
US-based spot Ethereum ETFs, led by BlackRock’s iShares Ethereum Trust (ETHA), recorded inflows totaling $148.5 million on July 3 and approximately $510 million in positive net flows over the last two weeks, according to data from Farside Investors.
Related: ETH traders target $3.2K after ‘golden cross’ debut — Derivatives data disagrees
Last week marked the eighth consecutive week of positive inflows into these investment products, with net flows topping 61,000 ETH.
#Ethereum Spot ETF flows have remained positive for the 8th consecutive week, with net inflows topping 61,000 $ETH pic.twitter.com/aTANkr4RCy
— glassnode (@glassnode) July 7, 2025
A recovery above $2,800 will depend on this trend continuing, which could result in ETH price rallying to new all-time highs in H2 2025.
ETH supply on exchanges at eight-year lows
One major factor supporting the bullish scenario is the reduction in supply on exchanges. Data from onchain data provider Glassnode shows ETH balance on exchanges has reached eight-year lows of 13.5%, levels last seen in July 2016.
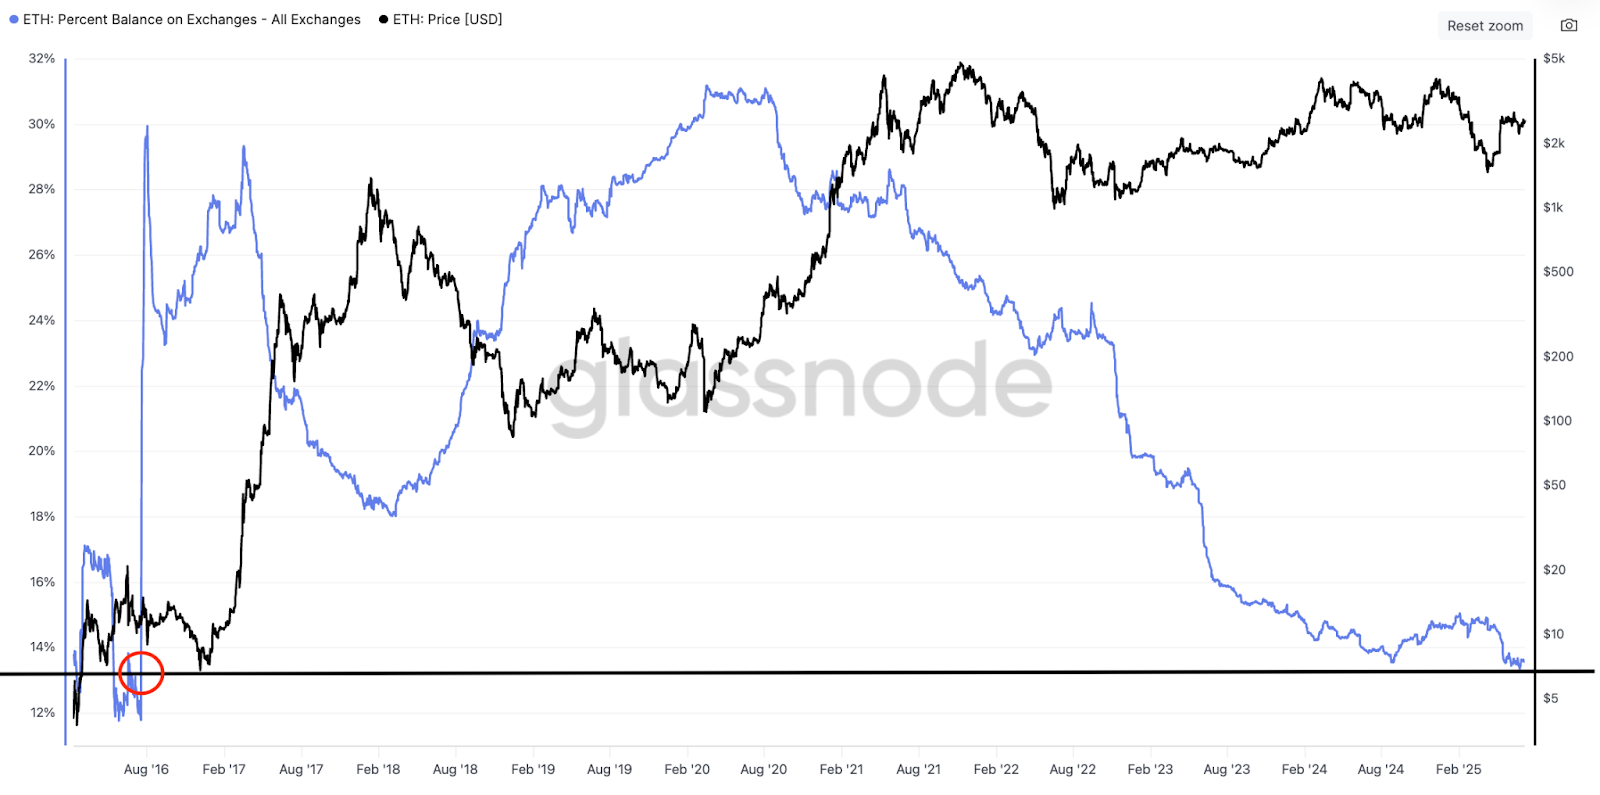
Diminishing Ethereum supply on exchanges may signal an incoming price rally fueled by a “supply shock,” which occurs when an uptick in demand meets a decrease in supply.
Whales often withdraw BTC after buying, signaling ongoing accumulation. With fewer coins available for sale, short-term sell pressure diminishes.
This is evidenced by a spike in accumulation by large holders over the last few weeks. More data from Glassnode shows that supply in wallets holding 100,000 or more ETH has increased since late May.
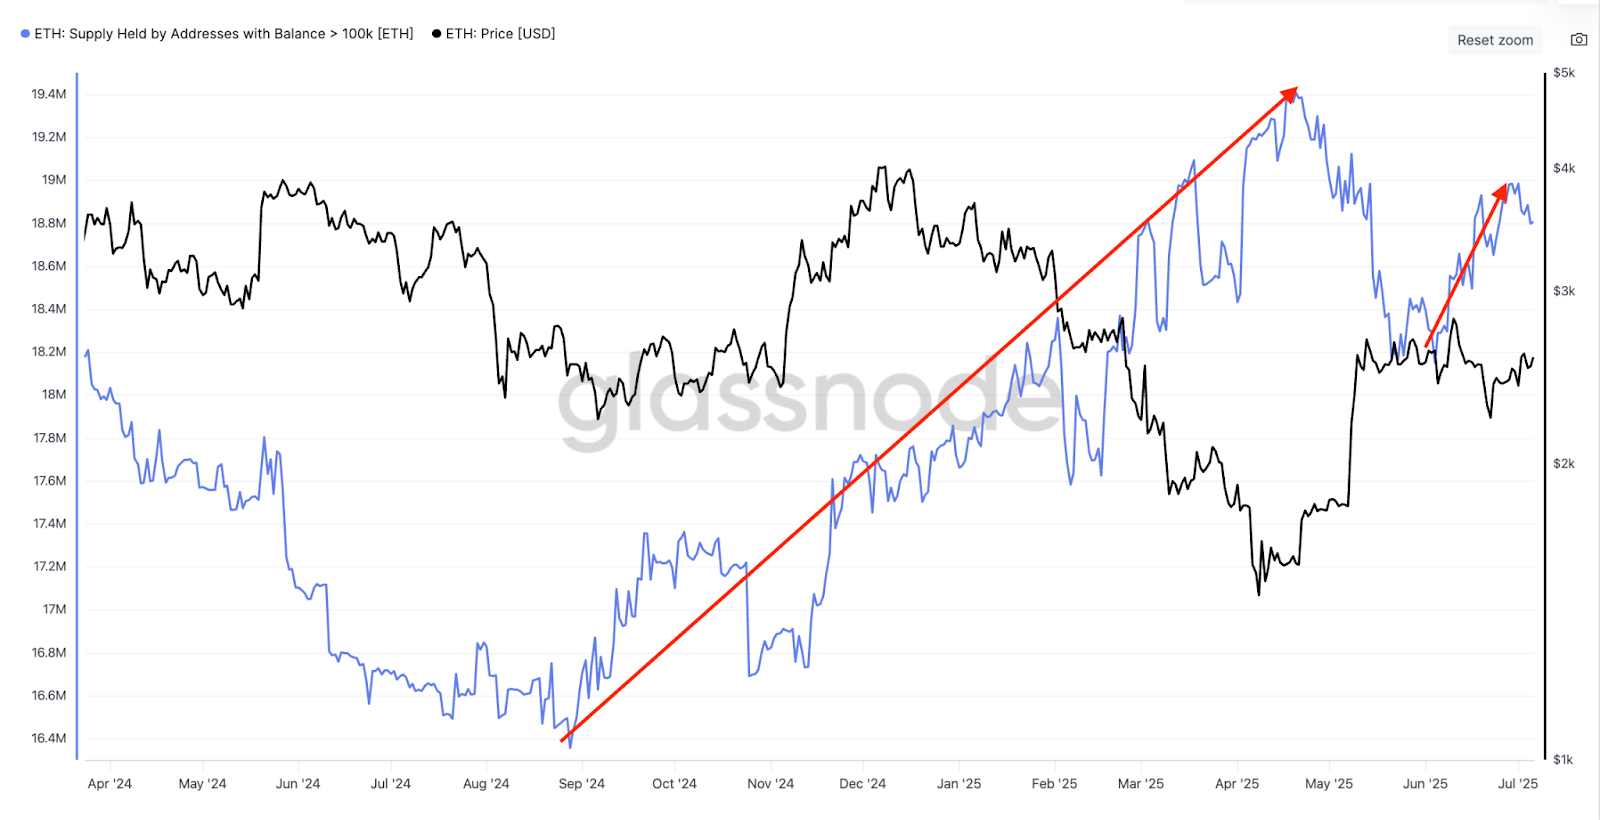
The chart above shows that wallets holding 100,000 or more have increased to 18.8 million ETH on July 7 from 18.1 million ETH on May 21, suggesting that whales have not been selling into the latest rally.
Ether’s SOPR suggests further ETH upside
The Spent Output Profit Ratio (SOPR) metric shows that profit-booking is not taking place despite most ETH holders being in profit.
SOPR is a metric that shows whether short-term holders are in profit or loss compared to when they first bought. A value above 1 indicates a high percentage of coins that have made a profit on their short-term investment, and a value below 1 indicates a high percentage of coins that are in loss.
The SOPR for Ethereum is currently at 1.01, reflecting confidence in the market and reluctance to sell at a loss. Historically, SOPR values above one during uptrends suggest room for upside.
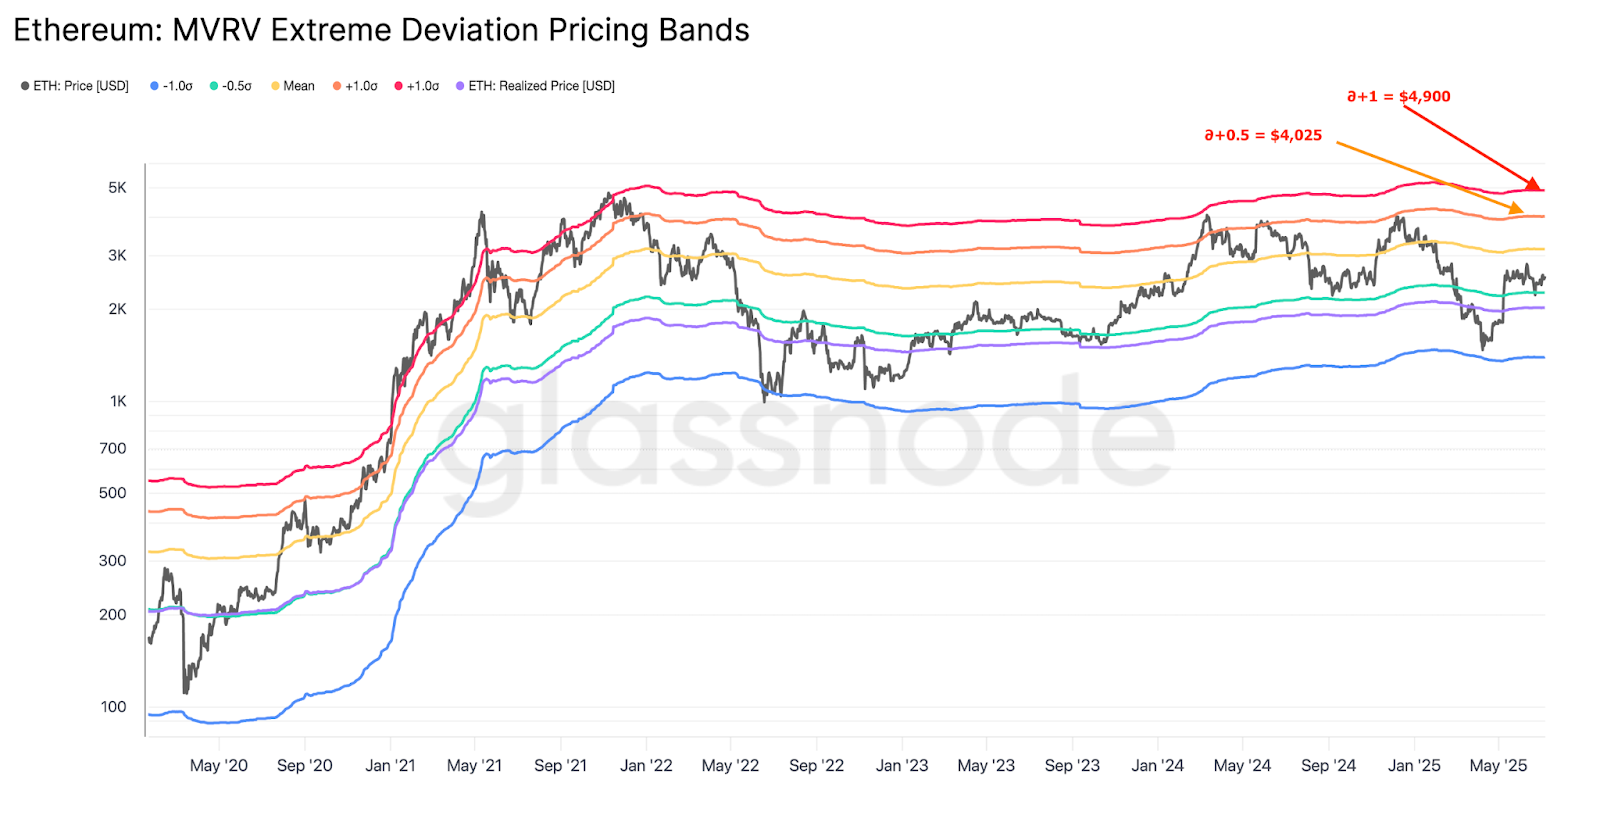
Ether’s MVRV bands hint at $5,000 ETH price
Since May, Ether’s price has generally traded from $2,400 to $2,800, per data from Cryptox Markets Pro and TradingView.
This is a well-defined range defined by the market value realized value (MVRV) ratio, which assesses whether an asset is overvalued.
Ether’s MVRV extreme deviation pricing bands suggest that ETH price still has more room for further expansion before the unrealized profit held by investors reaches an extreme level represented by the two uppermost MVRV bands between $4,000 and $5,000, as shown in the chart below.
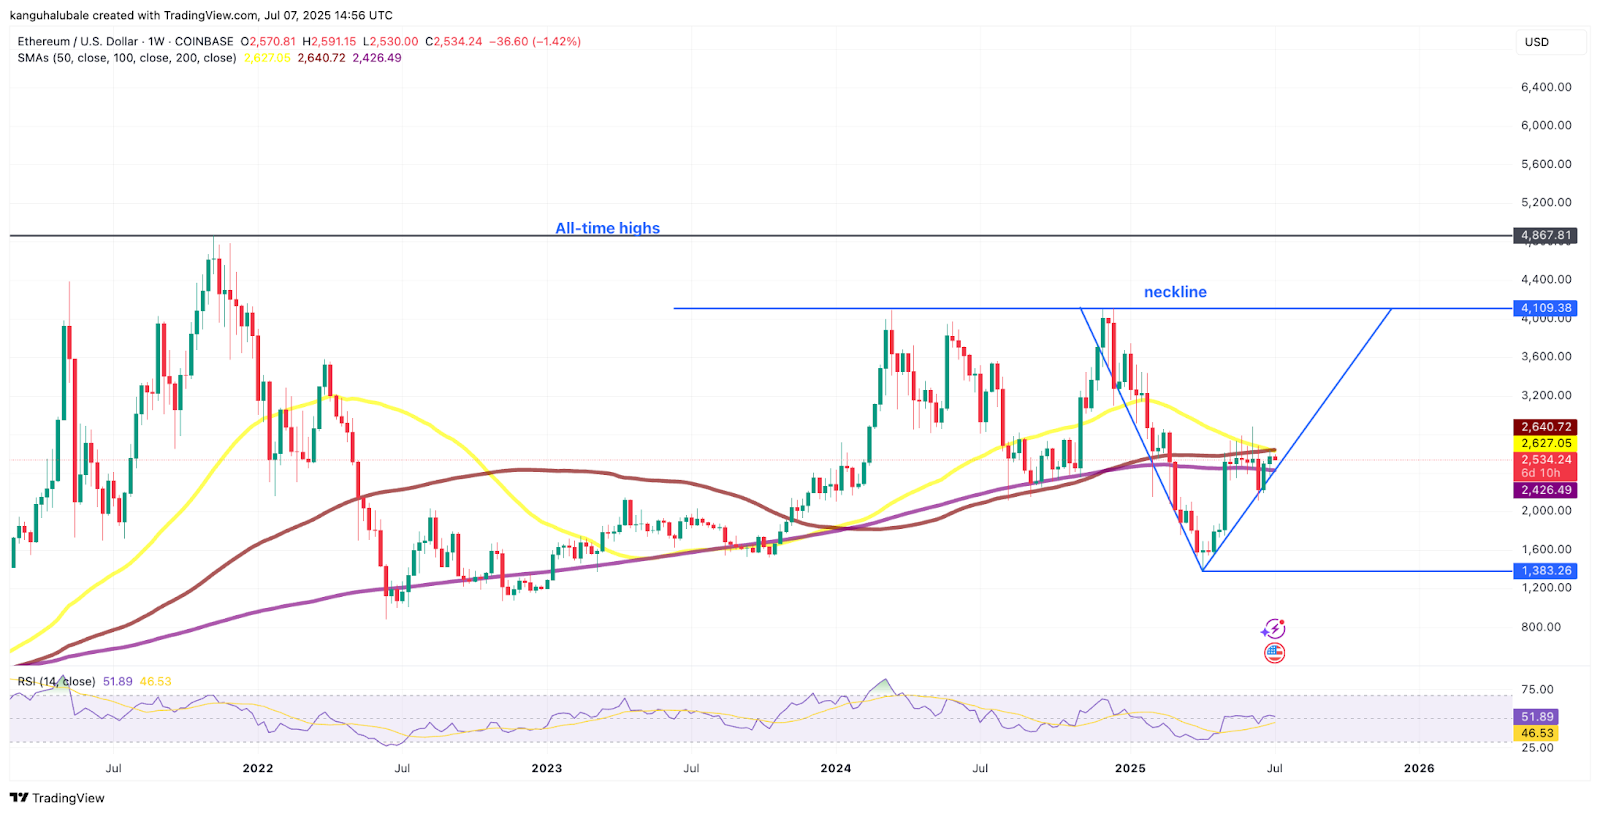
Ether’s price action has been forming a V-shaped recovery pattern on the weekly chart since December 2024, as shown below.
ETH now trades below a key supply-demand zone between $2,600 and $2,800, where the 100-day and 50-day simple moving averages (SMAs) sit. Bulls need to push the price above this area in order to increase the chances of the price rising to the neckline at $4,100 to complete the V-shaped pattern.
Higher than that, the next logical move would be toward the 2021 all-time highs of $4,800, representing a 92% increase from the current price.
Several analysts also believe that ETH has the ability to rise to $5,000 this year, citing Ethereum network upgrades, Power of 3 price pattern forecast, and increasing institutional demand from Ethereum treasury companies.
This article does not contain investment advice or recommendations. Every investment and trading move involves risk, and readers should conduct their own research when making a decision.
 Surges 30%, Tops Shiba Inu And Pepe In On-Chain Holders")

