

Toncoin (TON) has surged by over 50% in the past week, fueled by news that Telegram founder Pavel Durov has been granted permission to leave France for Dubai.
TON/USDT weekly price chart. Source: TradingView
TON’s bullish reversal, especially after falling to $2.35, its lowest level in a year, has traders eyeing key price levels, with crypto analyst Crypto Patel highlighting a “great entry zone” for long-term investors.
TON is eyeing a 100% rally in 2025
As Crypto Patel notes, TON’s price has “perfectly bounced” from its support level of around $2.50.
Furthermore, the support falls inside the $2.40-3.00 area that served as resistance in December 2022-April 2023 and September 2023-April 2024 periods. The analyst argues that the area now served as a “great entry zone,” citing TON’s ongoing rebound from the same range.
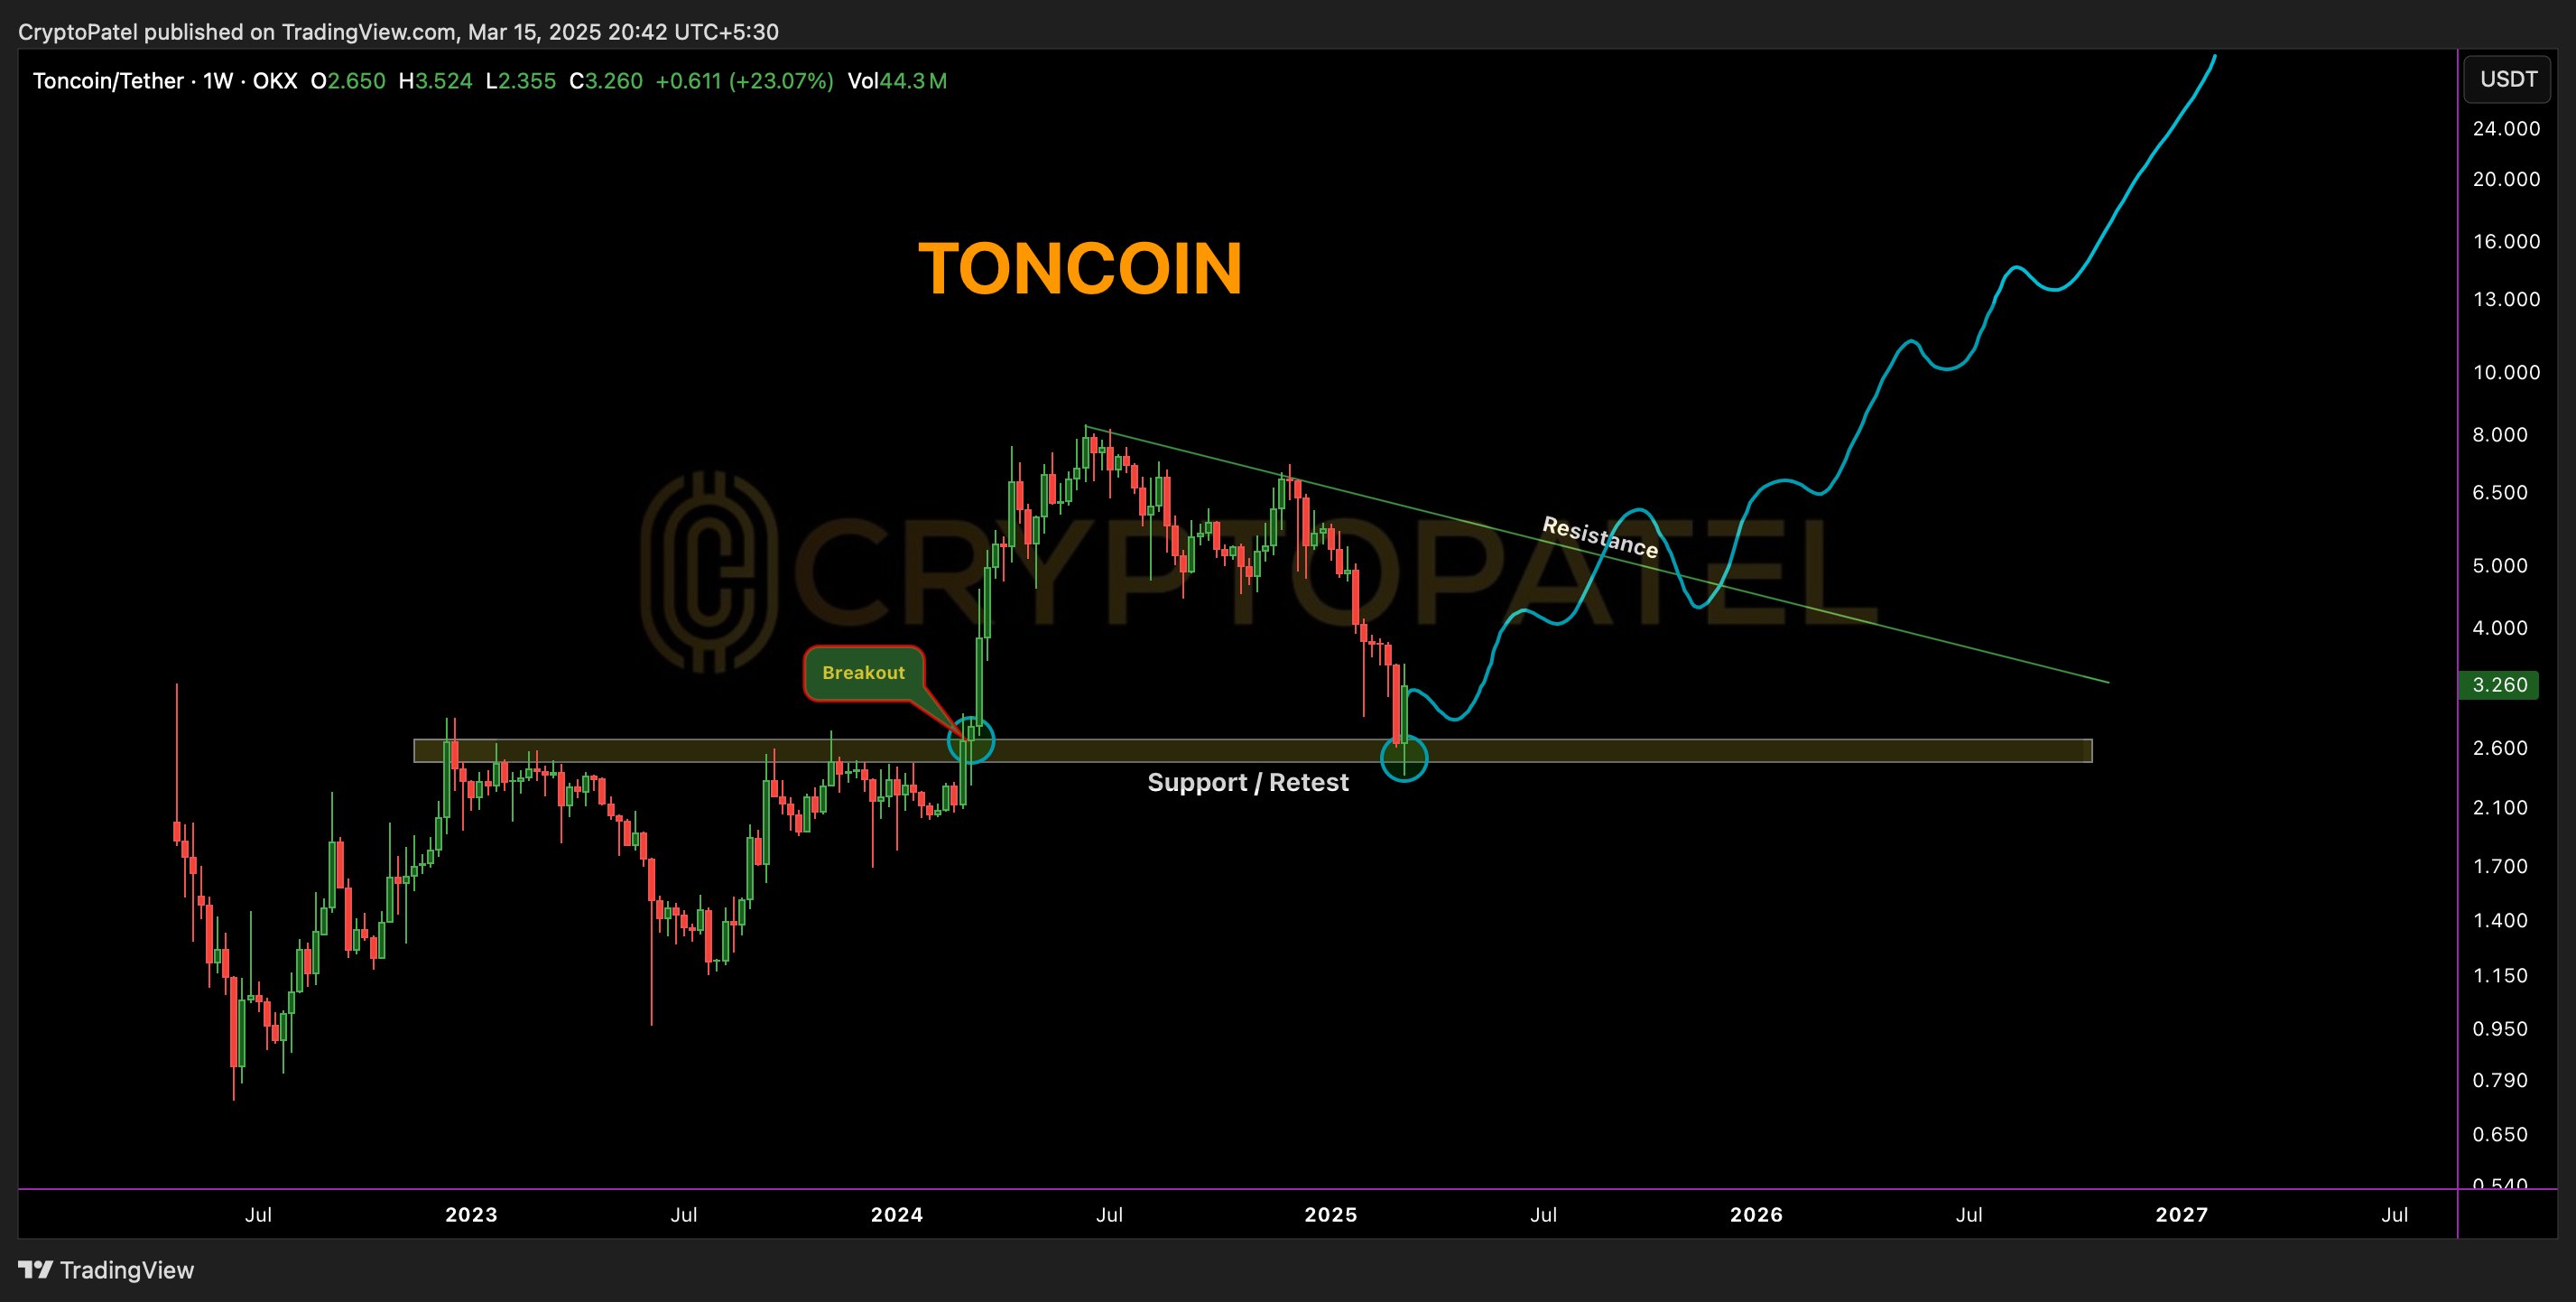
TON/USDT weekly price chart. Source: TradingView/Crypto Patel
A decisive rebound from the $2.40-3.00 zone could have TON target its prevailing descending trendline resistance in the coming weeks, which may push its price toward $5 by June or July.
Related: Wallet in Telegram to list 50 tokens and launch yield program
The upside outlook aligns with analyst Profit Mind’s falling wedge setup, which anticipates the Toncoin price to grow toward the $6 upside target if it breaks above the wedge’s upper trendline.
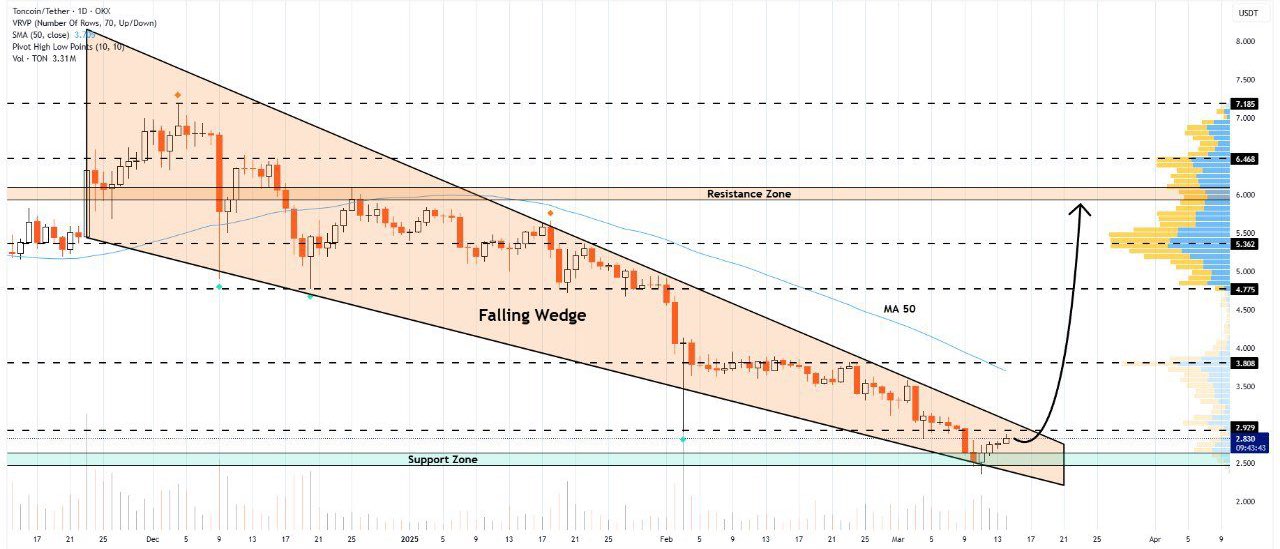
TON/USDT daily price chart. Source: TradingView
Falling wedges typically resolve when the price breaks above the upper trendline and rises by as much as the pattern’s maximum height.
Analyst Crypto Billion further anticipates a bullish reversal in TON markets, citing its oversold relative strength index (RSI) as a primary catalyst for potential long-term accumulation.
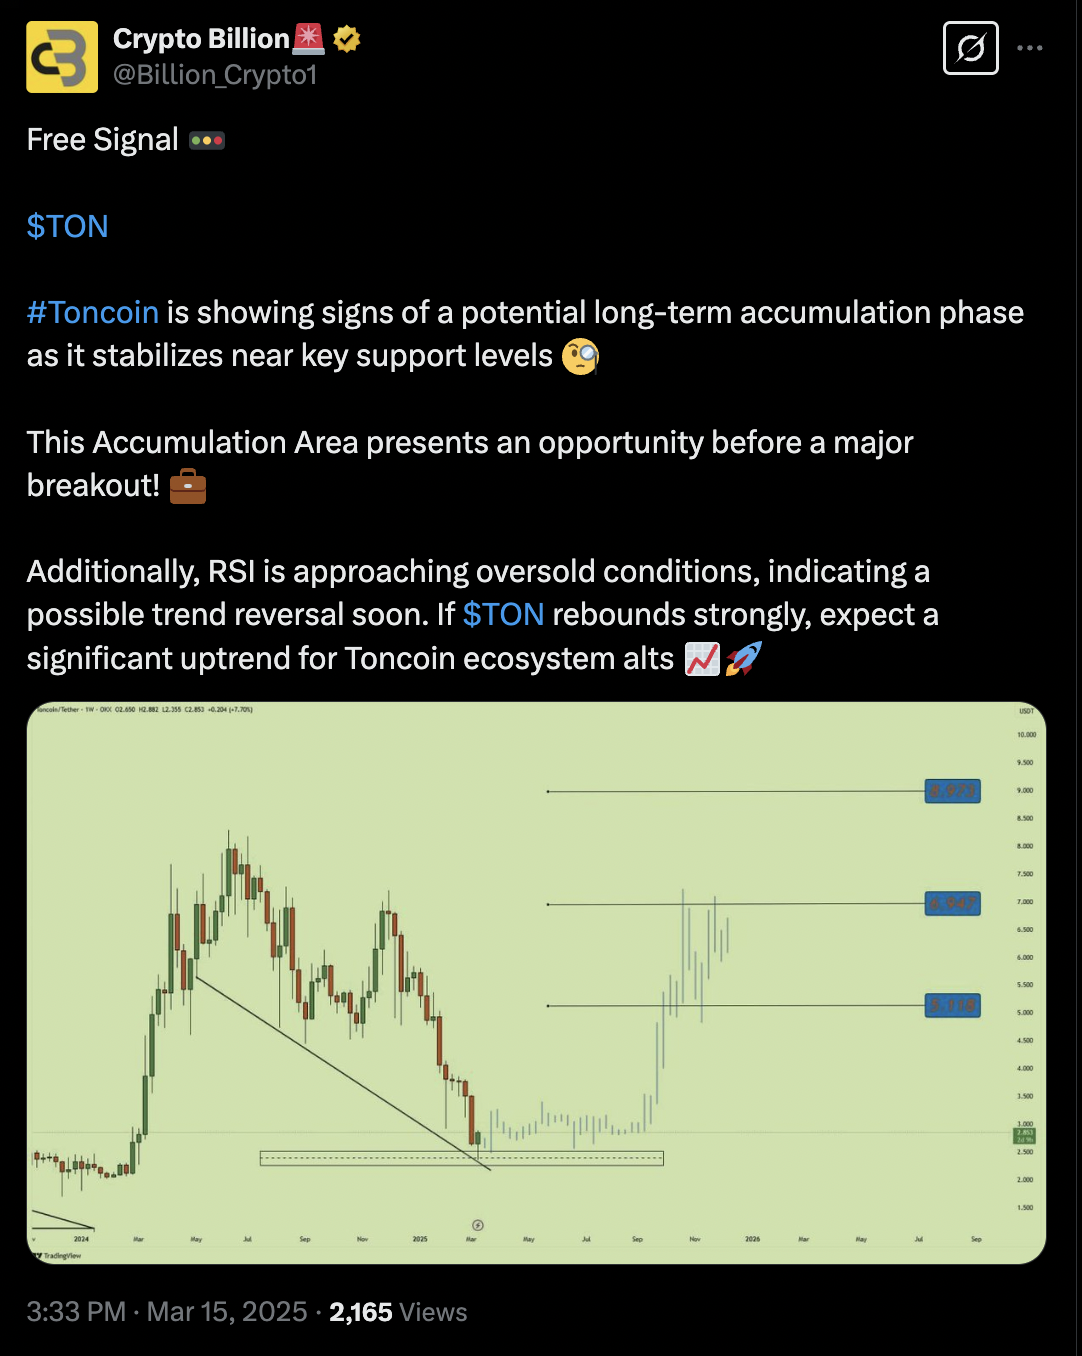
Source: Crypto Billion
Toncoin’s Sharpe ratio, a financial metric used to measure an asset’s risk-adjusted returns, further indicates oversold conditions in the TON market.
As of March 16, the 180-day average ratio had dropped below -25, as denoted in blue. In the past, TON has undergone bullish reversals largely when its Sharpe ratio turned blue, as seen in late 2022 and mid-2023.
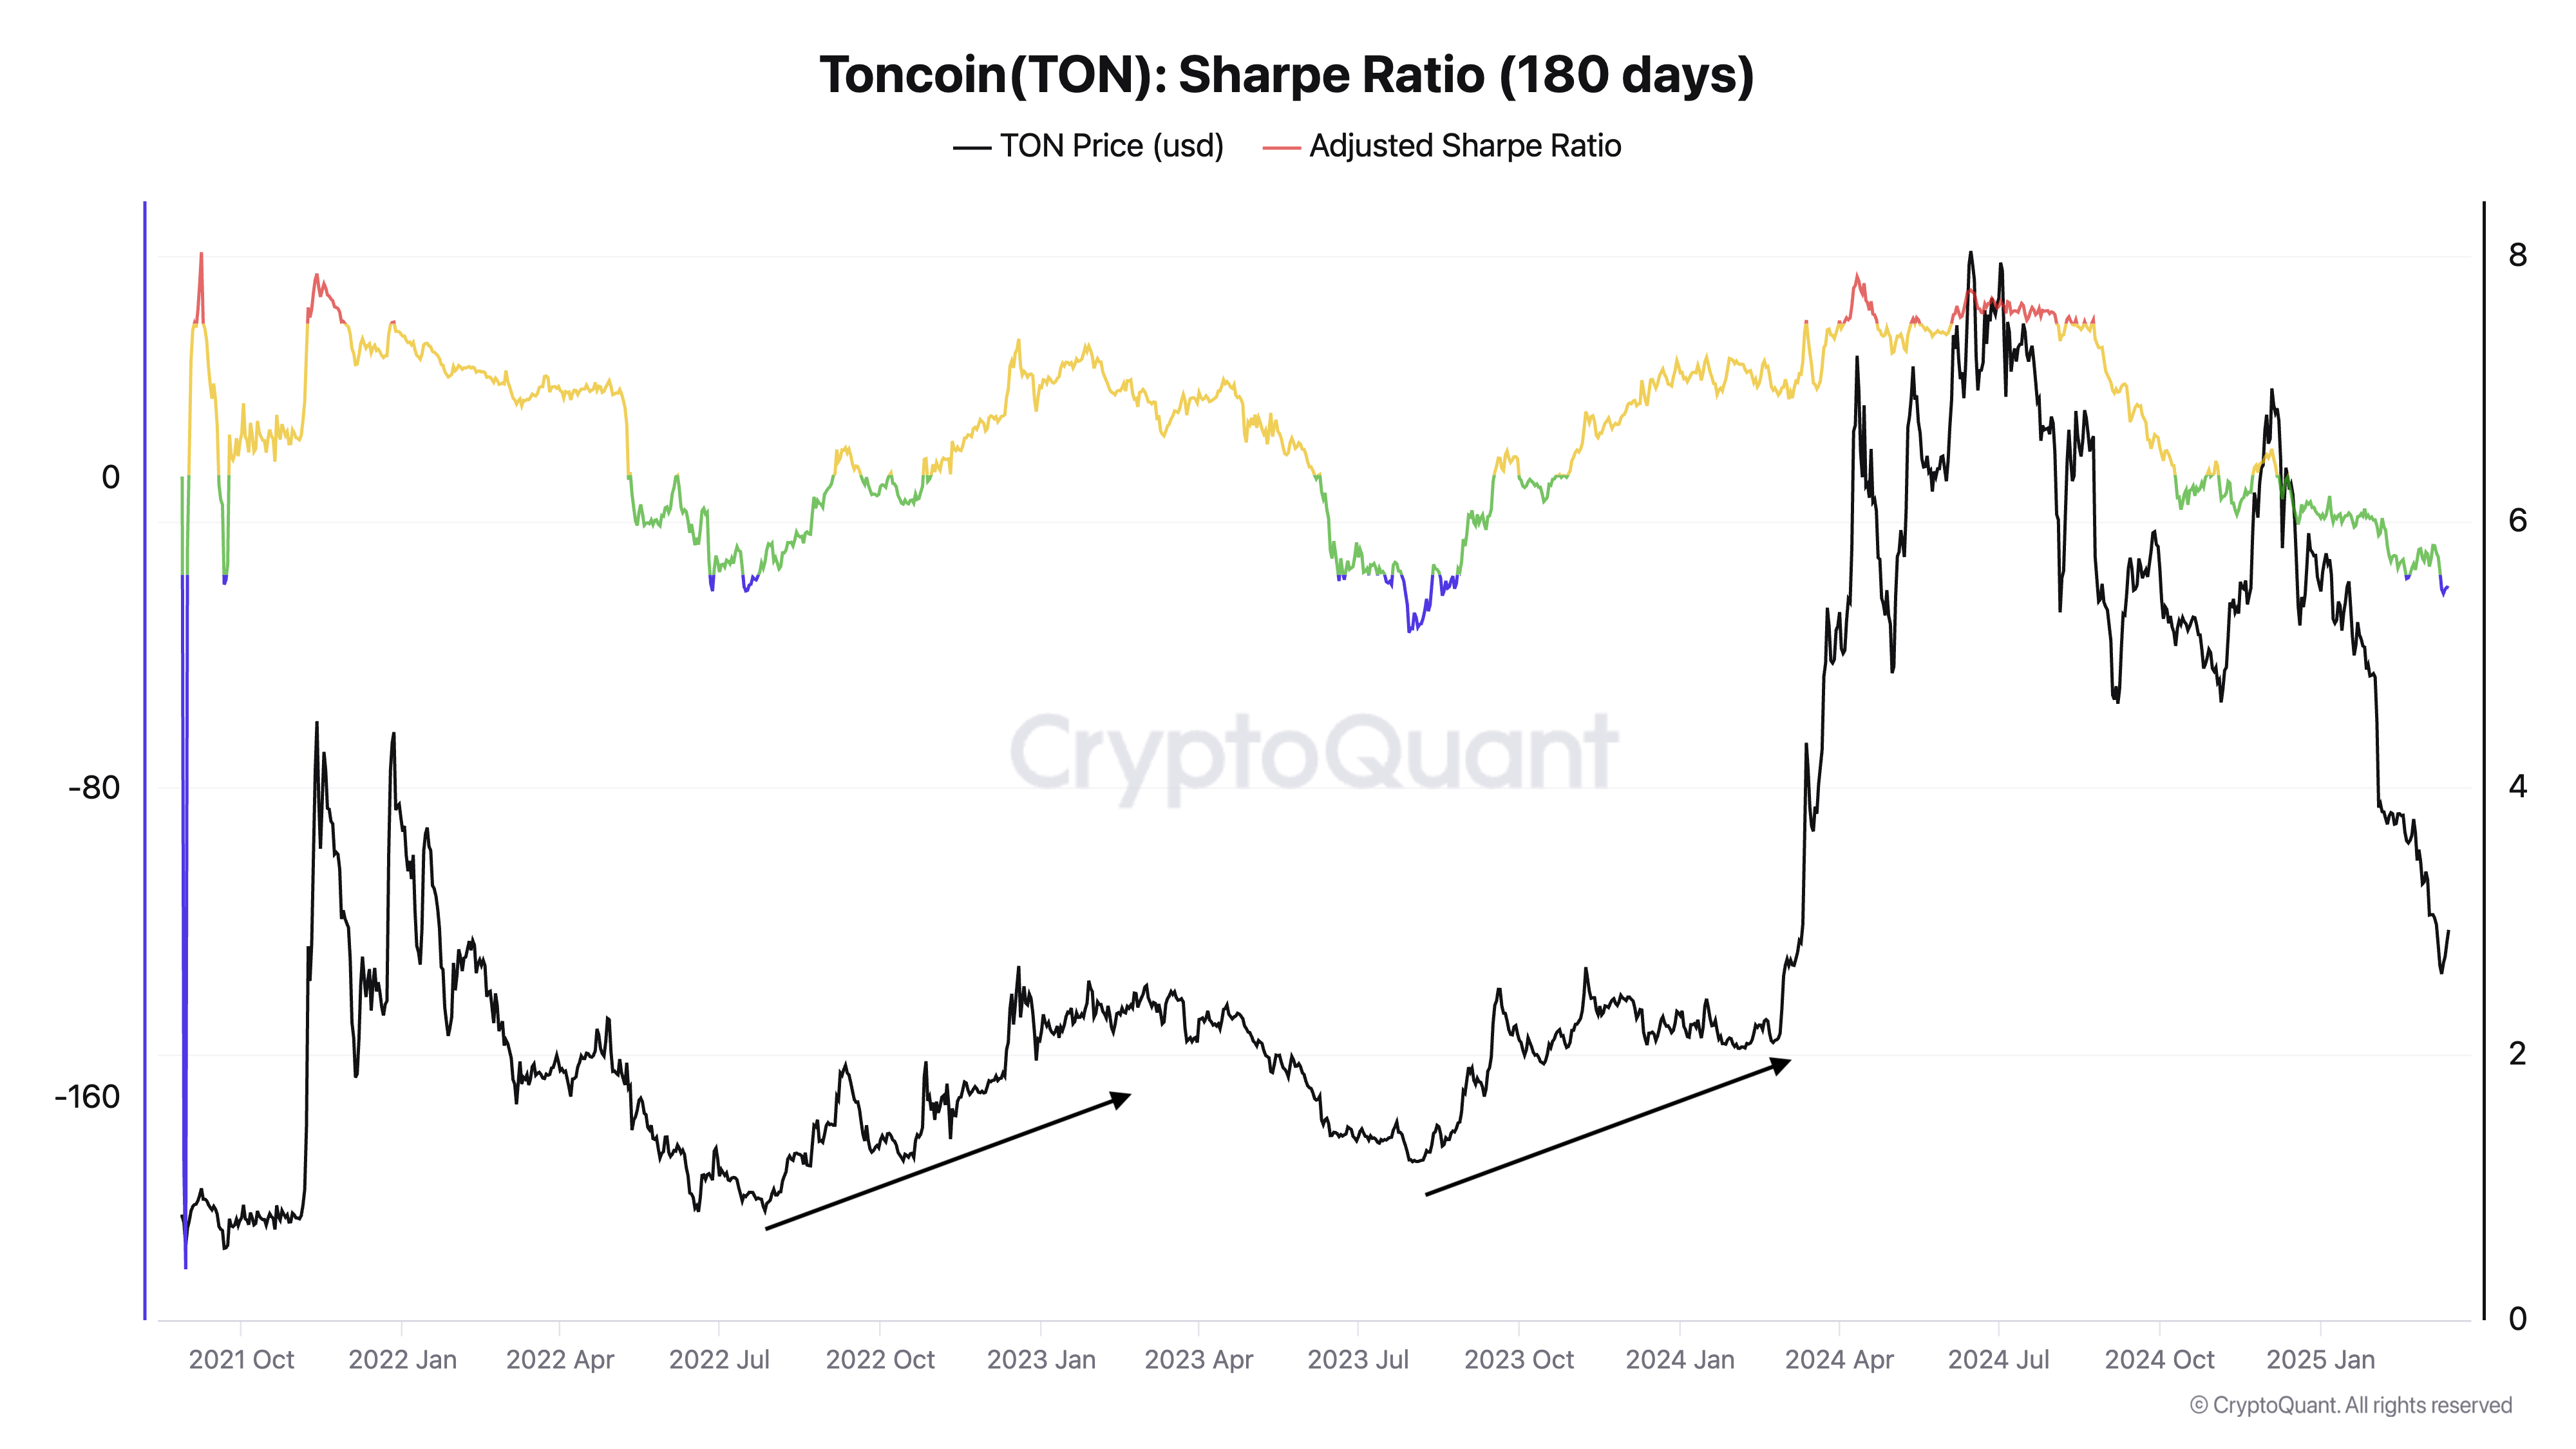
TON Sharpe ratio (180 days). Source: CryptoQuant
TON shorts remain dominant
In the derivatives market, Toncoin is witnessing a resurgence in its open interest (OI) — a metric tracking the total number of unsettled TON contracts such as options and futures.
As of March 16, TON’s OI was around $169.12 million, compared to $80.75 million just five days prior.
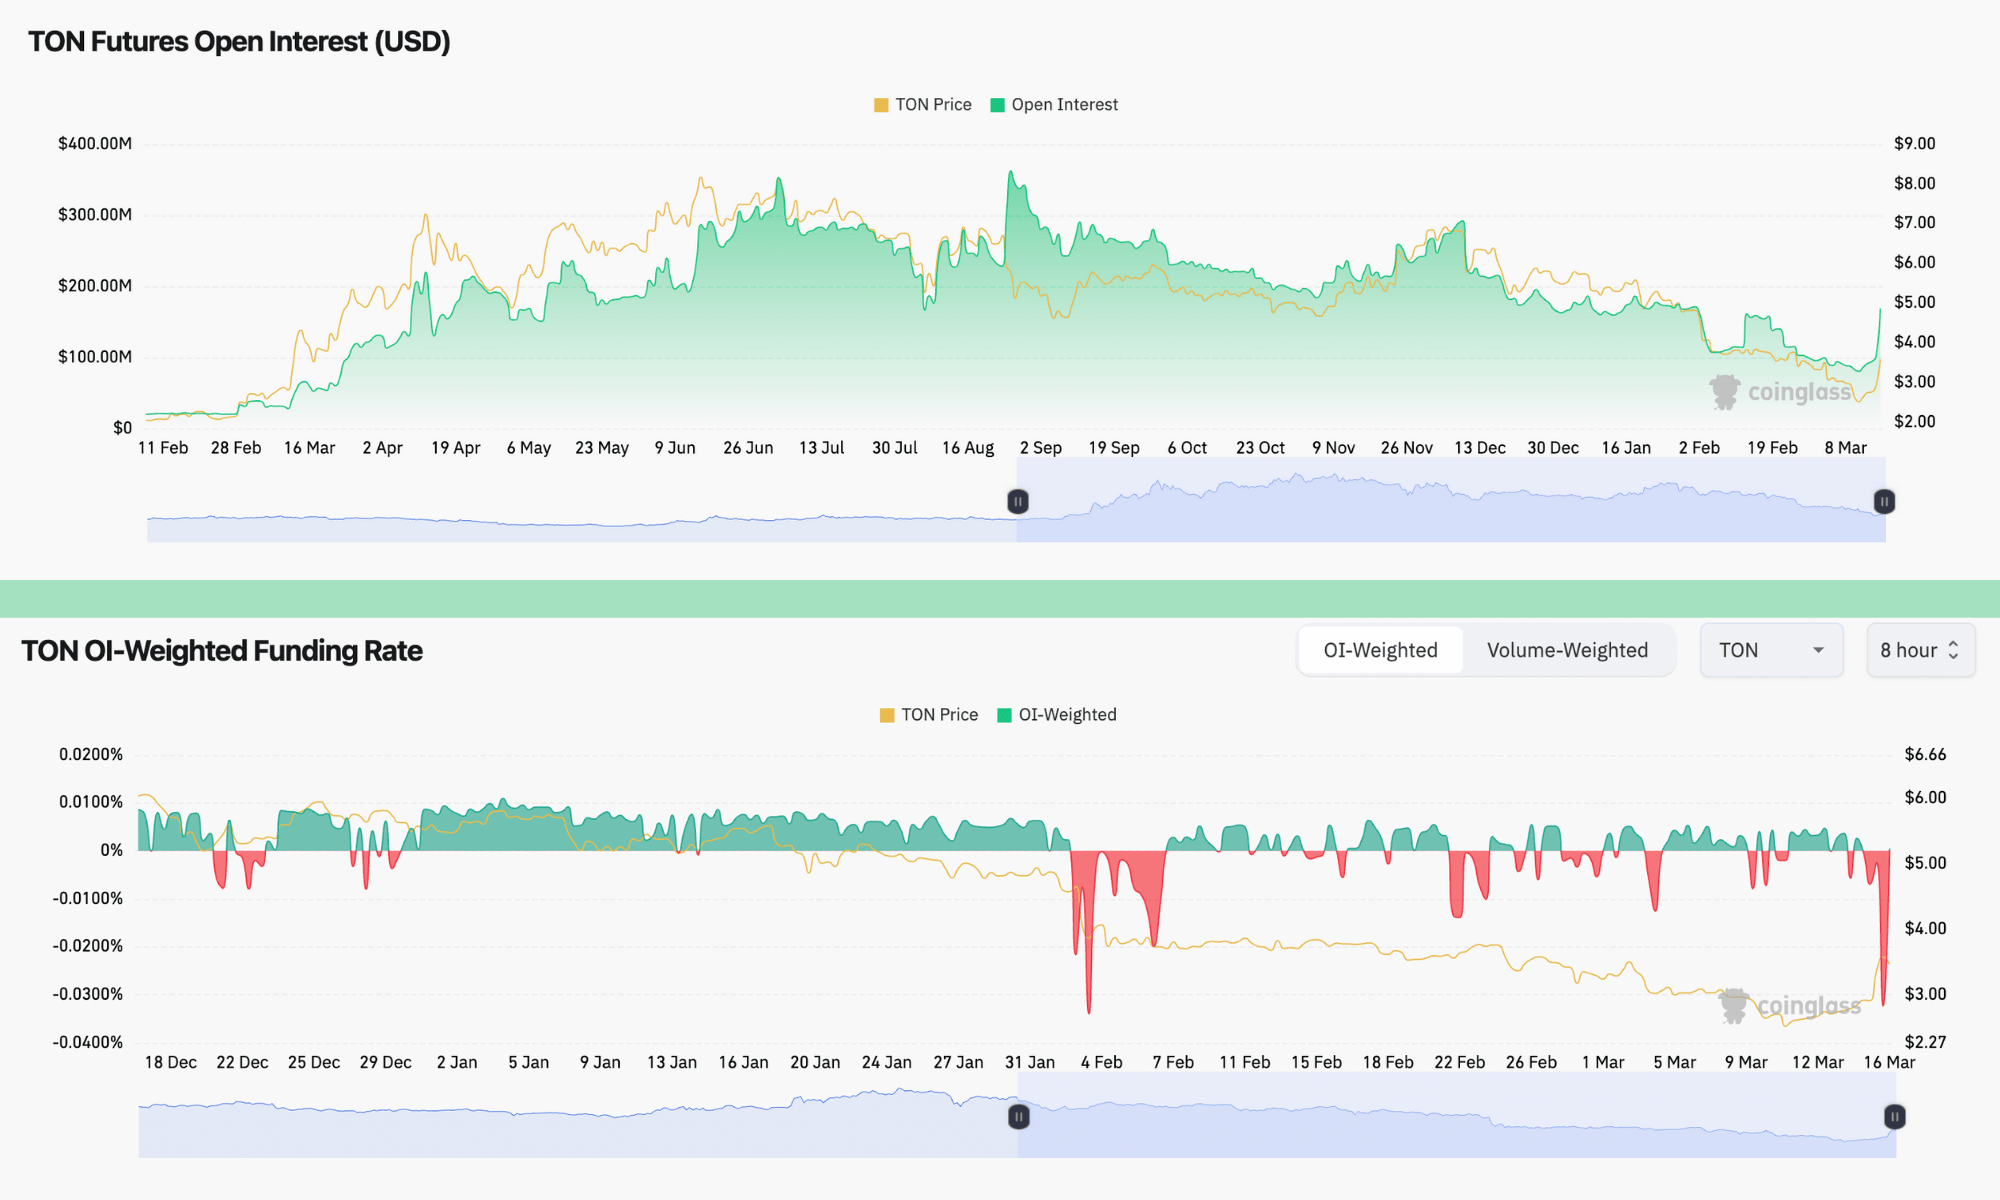
TON Futures’ OI and funding rates. Source: CoinGlass
On the flip side, TON’s weekly funding rates are treading around negative territory — they marginally rose into positive territory after plunging to -0.678% earlier on March 16.
When funding rates turn negative as OI rises, it often reflects bearish sentiment with aggressive shorting. The 30-day liquidation map tracking TON/USDT on Bybit risks nearly $10 million in long liquidations if the Toncoin price falls toward $2.54.
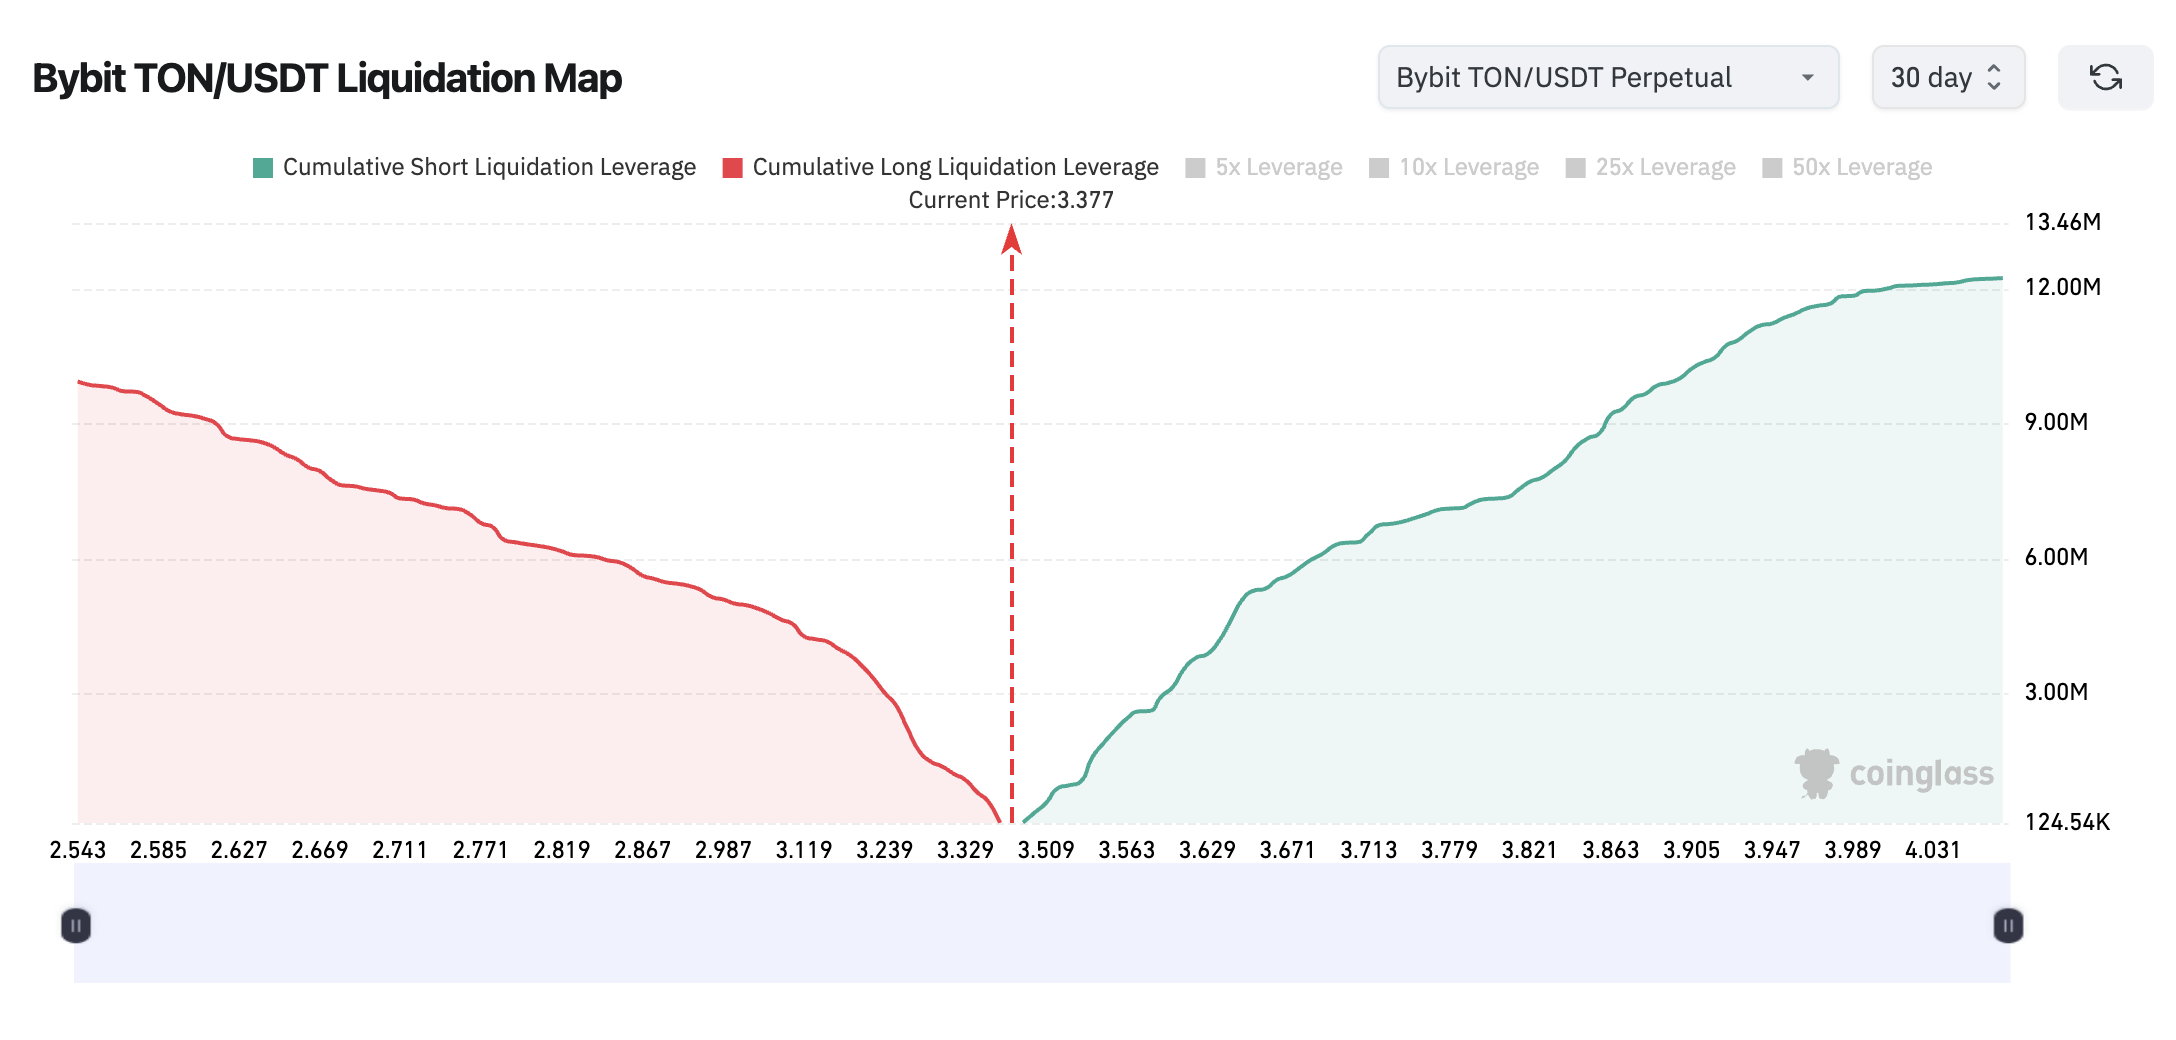
Bybit TON/USDT 30-day liquidation map (as of March 16). Source: Coinglass
Conversely, the same liquidation map reveals that approximately $12 million worth of short positions could be at risk if TON surpasses the $4 mark.
If this scenario plays out, the cascading effect of forced buybacks could accelerate Toncoin’s upward momentum, sending the price to the aforementioned levels.
This article does not contain investment advice or recommendations. Every investment and trading move involves risk, and readers should conduct their own research when making a decision.


