
Solana (SOL) is now trading around a crucial supply zone after an impressive 26% surge since September 18, following the Federal Reserve’s announcement of interest rate cuts. This sharp rally has sparked optimism among analysts and investors, who hope Solana could soon reach new all-time highs.
Related Reading
Many in the crypto space believe Solana is primed for further gains, with some expecting it to outperform the broader market in the coming months. One prominent analyst, Carl Runefelt, has shared a technical analysis on X, highlighting the potential for a parabolic move once SOL breaks through its yearly high.
With growing attention to Solana’s strong fundamentals and technical strength, the market is closely watching to see if SOL can maintain its upward trajectory and deliver the explosive gains many anticipate.
As Solana hovers near these key levels, the next few days could be critical in determining whether it will continue its upward march or face renewed selling pressure.
Solana To $200 Before New ATH
Solana (SOL) is now testing a key liquidity area, and investors are closely watching for the next price move. After a bullish run over the past two weeks, many expect a surge that could push SOL higher. However, some concerns remain that Solana might underperform this cycle compared to other leading altcoins, which have shown stronger market activity.
Prominent crypto analyst Carl Runefelt recently shared a detailed analysis on X, highlighting a bullish “cup and handle” pattern forming in Solana’s price action. This pattern, often seen as a signal for continued upward momentum, has a clear resistance level of around $200. Runefelt believes that once Solana breaks past this key level, the price could go parabolic, with the next major target being the all-time high (ATH) of around $260.
In his analysis, Runefelt emphasizes that breaking through the $200 resistance will be crucial for Solana’s price action. Once this happens, he predicts a rapid and aggressive move to new highs.
The cup and handle formation is a classic bullish continuation pattern frequently leading to sharp price increases, suggesting that Solana could be set for a major breakout.
Related Reading
With the market sentiment still bullish and Solana testing critical levels, the next few weeks could determine whether the asset will achieve the explosive gains many anticipate.
SOL Testing Crucial Supply
Solana (SOL) is trading at $156, following a 13% move from last week’s lows. The price has successfully reclaimed the daily 200 moving average (MA) at $154, holding it as support—a bullish signal that could propel SOL to higher levels shortly.
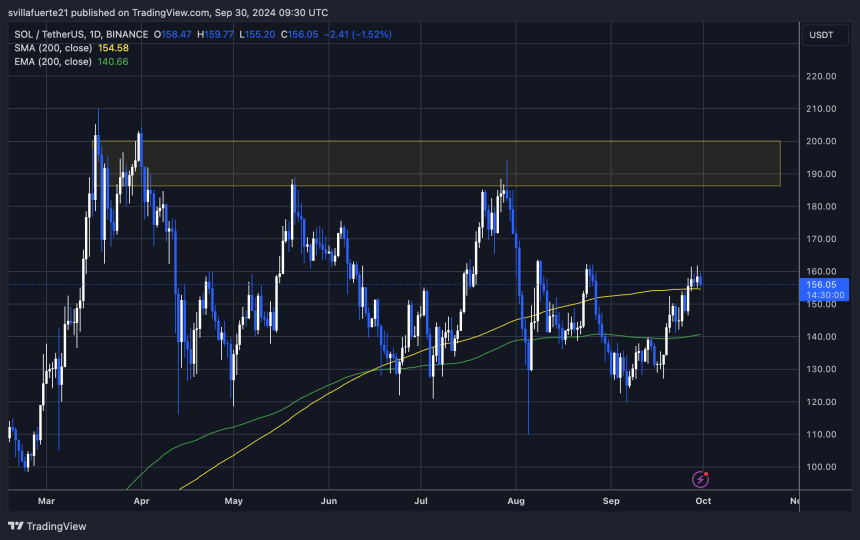
However, SOL is facing resistance at the $163 local high, where it has been struggling to break through. Bulls need to push the price past this critical level to trigger a rally toward the yearly high of around $210. This would further strengthen the positive sentiment around Solana as investors and traders look for confirmation of a larger upward move.
On the downside, if SOL fails to break past the $163 resistance, a retracement to lower demand levels around $140 becomes more likely. This would represent a critical test for the asset, as a failure to hold support at these lower levels could weaken the bullish momentum built over the past few weeks.
Related Reading
With SOL hovering near key levels, the next price move could set the stage for a rally toward new highs or a deeper pullback.
Featured image from Dall-E, chart from TradingView


