Coinspeaker
Solana Price Cracks 8% as Blockchain Revenue Tanks, What’s Next?
World’s fifth-largest cryptocurrency Solana (SOL) has come under severe selling pressure, cracking nearly 8% in the last 24 hours, and slipping all the way under $125. This happens as the Solana blockchain revenue has tanked to its lowest over the last week, to $626,900.
The decrease in the revenue comes after the Solana upgrade some days ago. Earlier this month in June, the Solana project asked the validators to upgrade to a new node. The goal behind this development was to overcome the congestion issues experienced by the Solana network for some time.
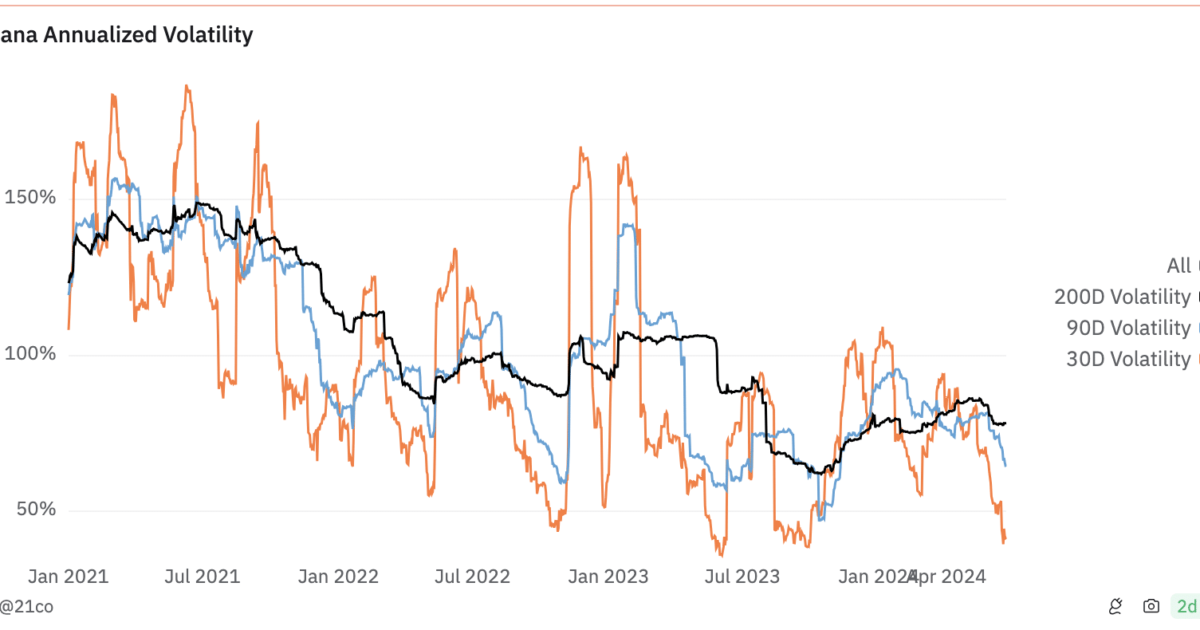
As a result of this upgrade, the Solana fees were no more skyrocketing while the network maintained its throughput of 2,000 to 3,000 Transactions Per Seconds (TPS). However, the Solana volatility chart shows that the SOL price can show sideways movement. Volatility is an indicator of how quickly the SOL price can move. Higher volatility suggests that the SOL price can surge to extremely high levels within a very short period of time. Similarly, lower volatility implies the other way.
Solana’s 200-day annualized volatility was 77.80%, and over the last 90 days, it was 66.30%. However, at press time, Dune data showed it had dropped to 39.60%. This decrease suggests that SOL might continue trading within a narrow range in the coming days.
Solana Active Addresses Surge
Prominent X Account SolanaFloor, shared that the Solana blockchain has attained a significant milestone with the monthly active addresses surpassing 30 million hitting a new all-time high. However, despite making this record high in monthly active addresses, Solana’s daily transactions have tanked over the past month. Furthermore, the blockchain’s captured value also saw a decline, with a considerable drop in revenue and fees.
This trend was mirrored in Solana’s TVL (Total Value Locked) chart, indicating a decrease in the blockchain’s performance within the DeFi space.
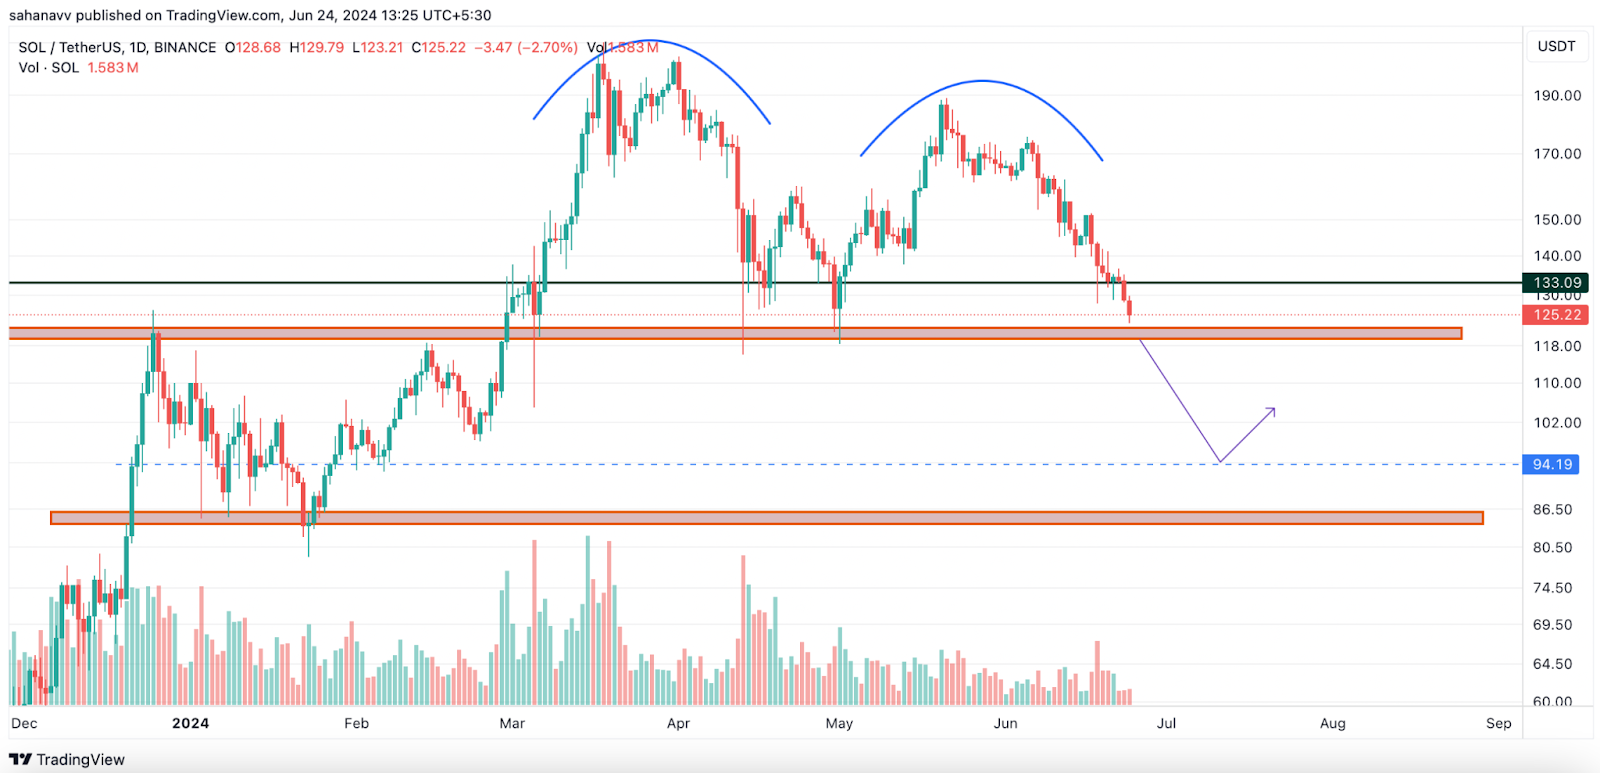
Moreover, the technical chart shows that buyers are showing major weakness as of now and the Solana price can see a further downfall of 8-10% in the next few days. As the markets are heading to the end of the first half of 2024, hence there could be more volatility this week ahead.
However, the drop in the trading volumes over the past 40 days shows that the trend has shifted in favor of the bears. As shown in the below chart, the SOL price is entering the liquidity area after forming the double-top pattern.

Photo: TradingView
The price has encountered resistance upon entering these areas, rebounding several times, thereby establishing a pivotal and decisive zone. This zone now coincides with the neckline of an ‘M-shaped’ pattern, suggesting a potential significant pullback ahead. As the market approaches the monthly closing, expectations lean towards a continuation of the bearish trend, possibly breaking below the crucial support level of $100
Solana Price Cracks 8% as Blockchain Revenue Tanks, What’s Next?


