Solana is on a downtrend currently, price of the altcoin has slid below the vital support line of $40. This downslide comes in the middle of a network outage, yet again! A software glitch was responsible for causing an outage that lasted over 4 hours.
Solana had also experienced another major outage in the month of January which stretched over 18 hours. This has apparently affected the Solana ecosystem as constant outages causes traders to lose their portfolio value simultaneously.
Over the last 24 hours, the altcoin lost about 6.4% of its value. In the last week, SOL depreciated over 12%. After a period of consolidation, SOL attempted to rise but the bears came back soon after. Right after the altcoin lost its critical support of $50, it has been constantly value ever since. Buying strength has also dropped owing to the recent downtrend.
Solana Price Analysis: One Day Chart
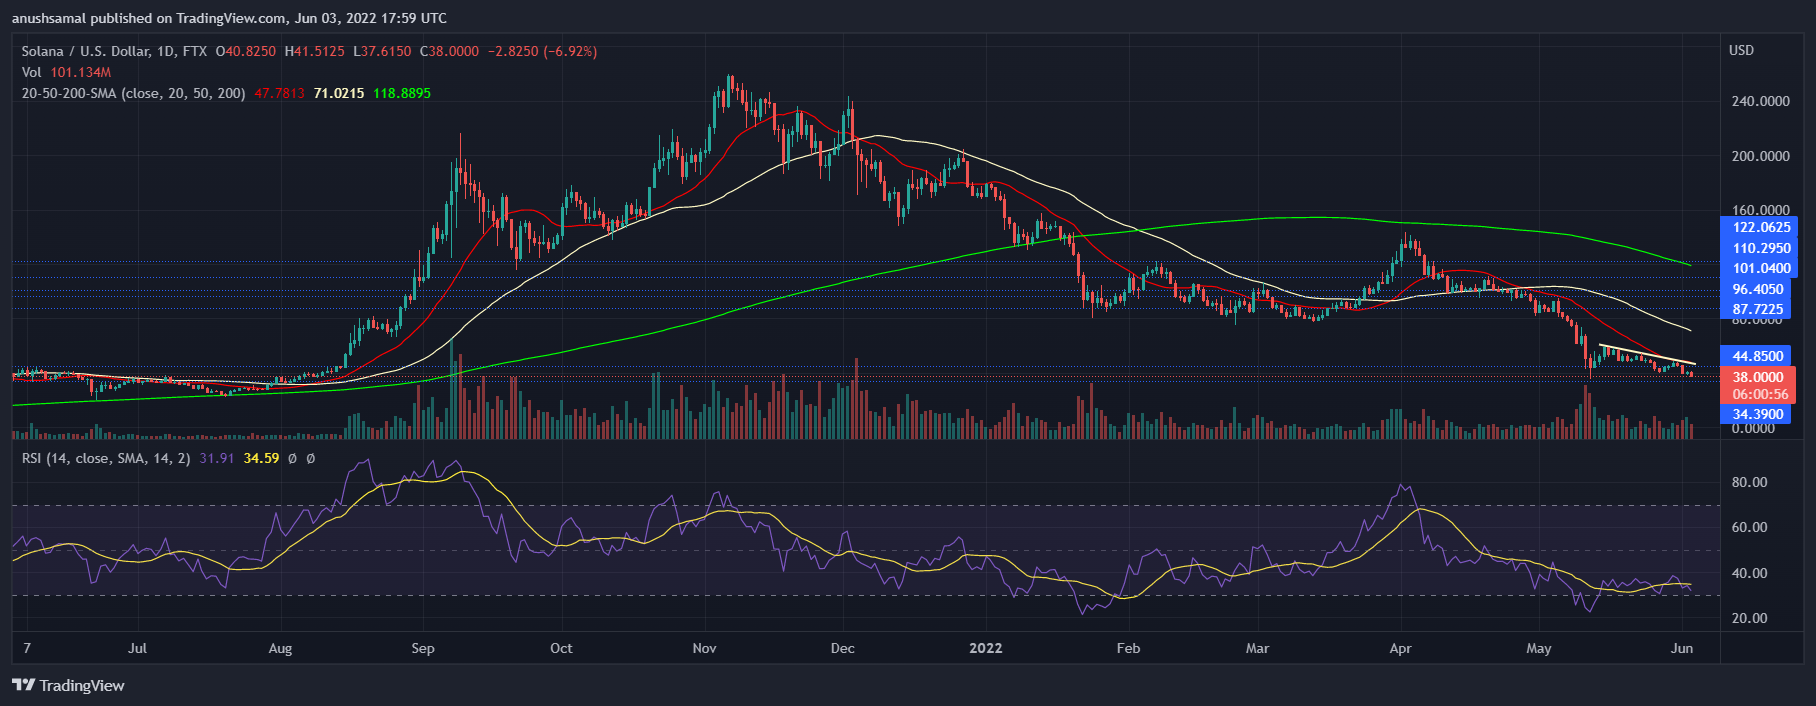
SOL was trading at $38 at the time of writing. It lost its crucial support of $40 and was on a downtrend. If SOL does not manage to stay at its current price level, it might aim for $34. The coin touched these price levels last at the month of August 2021. The descending trendline (yellow) agrees with downtrend in the market.
For the bulls to accumulate in order to invalidate the bearish thesis, the coin has to attempt for $50. The volume of the coin traded had declined and was in the red. This reading signified bearish dominance in the market.
Technical Analysis

SOL had attempted to briefly recover on the Relative Strength Index but at the time of writing the indicator noted a downtick. The Relative Strength Index was slightly above the oversold zone but pressure from the bears can cause SOL to become oversold.
As the sellers have taken over the market, the coin has fallen below the 20-SMA line. A reading below the 20-SMA line indicated that the sellers were driving the price momentum in the market. A slight push from the bulls could however, drag the price of SOL above the 20-SMA, which would then ease the selling pressure in the market.
Related Reading | Solana (SOL) Could Register An Upswing, Thanks To This Pattern

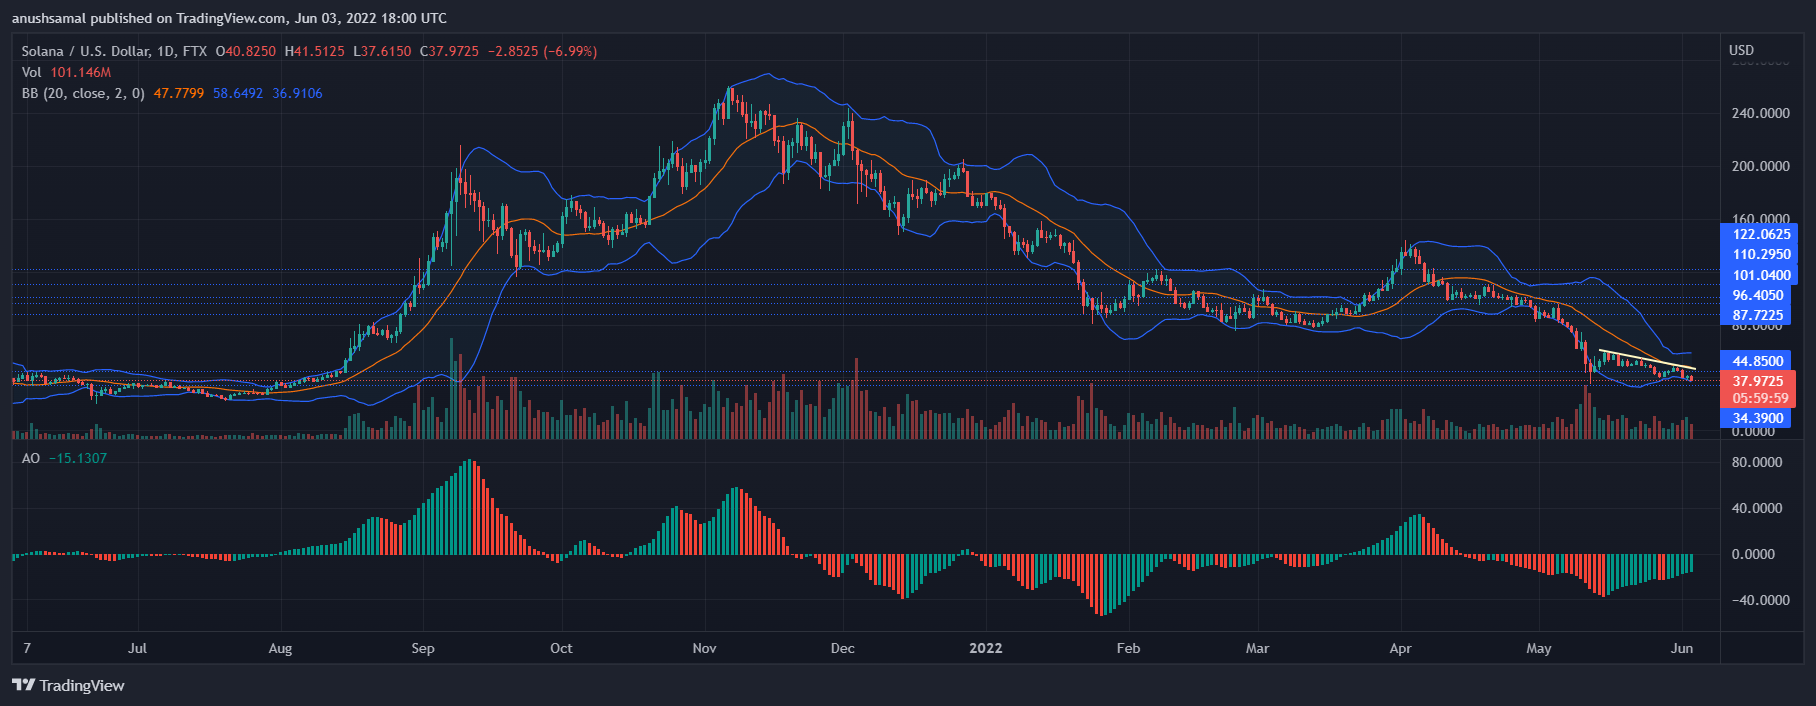
The Bollinger Bands responsible for depicting price volatility indicated that there was a squeeze release. A squeeze release essentially means that price volatility could be expected. Price of Solana could sway either way considering the above chart has painted mixed signals.
The Awesome Oscillator depicts the current price momentum and also a change in the same. The indicator flashed green signal bars which indicated a change in the momentum along with a buy signal.
A buy signal can be considered bullish if traders act on it.
Going by other indicators, it seems though SOL might be stuck in the same price action over the immediate trading sessions. A change can be expected if broader market extends support.
Related Reading | Can Bitcoin Bounce Back To $35K? Here’s What Stands In The Way


