

Key Notes
- Ethereum’s ETH/BTC ratio has dropped 77% since December 2021.
- Santiment notes that extreme bearish sentiment may trigger a contrarian bullish move.
- ETH is trading at around $1,549, down 4% over the past day.
Ethereum
ETH
$1 550
24h volatility:
2.7%
Market cap:
$187.04 B
Vol. 24h:
$20.47 B
has recently been facing a challenging time, losing $62 billion in market cap over just 15 days. The ETH/BTC ratio has dropped 77% since December 2021, signaling a severely poor performance against Bitcoin
BTC
$81 599
24h volatility:
0.1%
Market cap:
$1.62 T
Vol. 24h:
$43.81 B
.
Despite this, many analysts argue that this very pessimism might be the start of a major reversal.
According to market intelligence platform Santiment, Ethereum’s growing bearishness among investors could result in a bullish outlook for the cryptocurrency. It explained that markets generally tend to move in the opposite direction of public sentiment.
📊 Ethereum has been the source of humor for many top cap crypto traders, with the $ETH / $BTC ratio now down a massive -77% since December, 2021. But should its long-term slump make it an automatic write-off by now? Absolutely not. Read our deep dive. 👇https://t.co/JoK5GnI7Dm
— Santiment (@santimentfeed) April 11, 2025
Santiment also laid out the multi-pronged reasons behind Ethereum’s sluggish run: competition from fast-rising Layer-2 solutions, developer delays, high transaction costs, inconsistent narratives around its use case, and intense regulatory scrutiny.
Notably, Standard Chartered recently suggested that XRP
XRP
$2.01
24h volatility:
0.1%
Market cap:
$116.77 B
Vol. 24h:
$3.51 B
could surpass Ethereum in market cap by the end of the year — a claim that would have seemed unthinkable just a year ago.
On top of that, large-scale token sell-offs by long-time holders have added constant pressure to ETH’s price. As per the data by LookOnChain, an “Ethereum OG” recently sold nearly 8,000 ETH (worth $11.8 million) after being inactive for three years.
Another #Ethereum OG starts dumping $ETH after 3 years of dormancy!
He has sold 7,974 $ETH($11.8M) at $1,479 over the past 2 hours and still holds 30,606 $ETH ($45.7M).https://t.co/Le4ViWn6OW pic.twitter.com/WtRwPHQfqu
— Lookonchain (@lookonchain) April 10, 2025
Ethereum (ETH) Price Outlook
At the time of writing, Ether is trading around $1,549, down roughly 4% in the past 24 hours. Just days ago, it touched a two-year low of $1,385.
On the daily ETH price chart, the RSI sits near 36, indicating oversold conditions. This indicates that traders could see a possible bounce in the near-term.
Ethereum price RSI, Bollinger Bands indicators | Source: Trading View
Bollinger Bands show price sitting near the lower band, suggesting an opportunity for mean reversion. If the price manages to surge and break above the middle band (20-day SMA) around $1,800, ETH could confirm a potential trend reversal.
However, the MACD remains in bearish territory, with the signal line above the MACD line and red bars extending on the histogram. Buyers have stepped in near $14,50 in April, making it a key short-term support level.
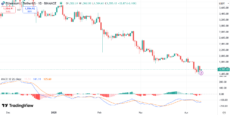
Ethereum price MACD indicator | Source: Trading View
Crypto analyst Ali Martinez also pointed out that ETH is approaching a historic support zone that has previously marked cycle bottoms.
#Ethereum $ETH is nearing a critical zone that has historically marked market bottoms and offered strong buying opportunities. pic.twitter.com/gZ4Tjrtqp0
— Ali (@ali_charts) April 10, 2025
According to Martinez, this could be a major buying opportunity for investors. If Ethereum holds its current levels, a relief rally could emerge.
Disclaimer: Coinspeaker is committed to providing unbiased and transparent reporting. This article aims to deliver accurate and timely information but should not be taken as financial or investment advice. Since market conditions can change rapidly, we encourage you to verify information on your own and consult with a professional before making any decisions based on this content.

A crypto journalist with over 5 years of experience in the industry, Parth has worked with major media outlets in the crypto and finance world, gathering experience and expertise in the space after surviving bear and bull markets over the years. Parth is also an author of 4 self-published books.


