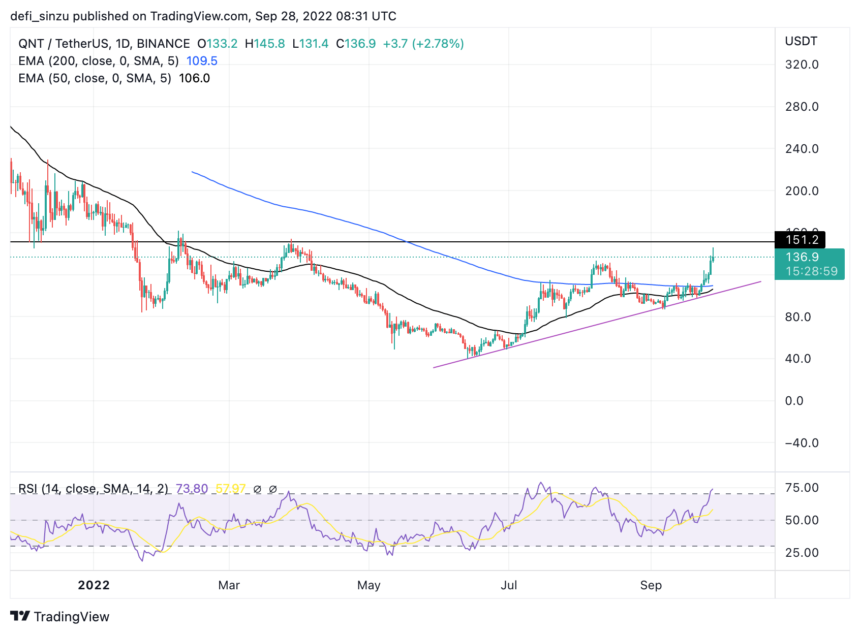
- QNT price holds strong above 50 and 200 EMA on a higher timeframe.
- QNT rallies as price eyes $160 despite the crypto experiencing a bloodbath across the market.
- The price faces resistance at $144 in the weekly timeframe.
Quant (QNT) price has recently shown bullish strength against tether (USDT) as price trends higher above expectations. The price of Quant (QNT) has shown its strength despite Bitcoin (BTC) pulling most altcoins down after a rally from $19,000 to a region of $20,400, with the price rejected instantly from that region. (Data from Binance)
Quant (QNT) Shines Despite Bloodbath
Despite the huge decline in price across the crypto market with what seems to be a bloodbath, the price of QNT continues to shine above the chart, as many expect this coin to perform extremely well when the market becomes stable.
The price of QNT on the high and low timeframe continues to trend with swing highs and lows as the price eyes a potential $160 reclaim.
Quant (QNT) Price Analysis On The Weekly Chart
The price of QNT has recently bounced from a low of $46 in the weekly timeframe rallying to a high of $130 before rejecting to a region of $87, where the price has formed good support for price sell-off on the weekly timeframe.
QNT price moved from that region breaking higher to $140, where the price is currently facing resistance to breaking higher to a region of $150-$160.
The price of QNT needs to break the $140 resistance with good volume for the price to have an opportunity to trend to a higher region; if the price of QNT is rejected, we would expect the price to retest the support area of $87 where demand for the price of QNT has been created.
Weekly resistance for the price of QNT – $140.
Weekly support for the price of QNT – $87.
Price Analysis Of QNT On The Daily (1D) Chart

In the daily timeframe, the price of QNT continued to show strength as the price faced rejection in an attempt to break $150, with the price holding strong and continuing to maintain its bullish structure.
If the price of QNT continues to hold above the trendline support it has formed on the daily timeframe, we could expect the price of QNT to break above $150.
The price of QNT trades at $137 above the 50 Exponential Moving Average (EMA). The 50 EMA acts as a support for QNT price at $106.
A break and close below $106 could see the price of QNT retest lower regions as this invalidates the bullish setup of $20.
Daily resistance for the QNT price – $150-$160.
Daily support for the QNT price – $106.
Featured Image From zipmex, Charts From Tradingview and Coin360


