Bitcoin and select cryptocurrencies are trying to start a rebound following the CPI data release, but bulls may find it difficult to continue the recovery at higher levels.
The United States consumer price index (CPI) rose 4.9% annually, which was slightly less than estimates of a 5% increase. The CPI’s monthly rise of 0.4% in April was in line with expectations.
Although inflation remains stubbornly higher than the Federal Reserve’s 2% target, traders will take comfort from the slower pace of increase. That suggests the Fed rate hikes are having an effect, and further rate hikes may not be necessary.
If the Fed pivots and starts to cut rates, as the FedWatch Tool projects, that may be positive for risky assets such as equities and cryptocurrencies. Bitcoin (BTC) responded positively to the CPI data and rose above $28,000 on May 10.
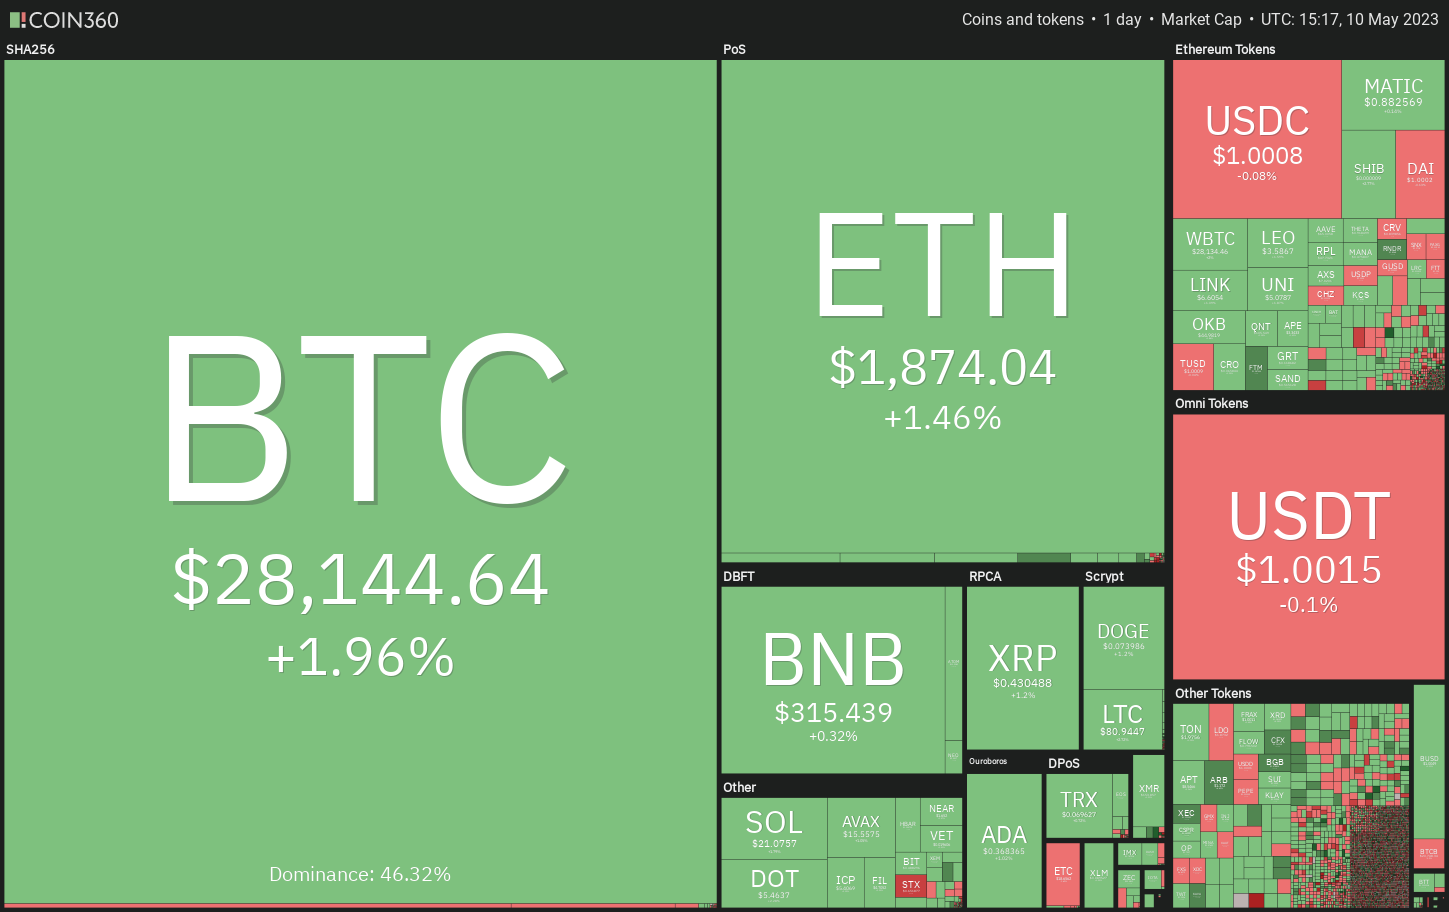
While the downside looks limited, the bulls may not have it easy at higher levels because of the high risk of a recession and the possibility of the banking crisis erupting again. That may keep the price stuck inside a range, which may act as a base for the next leg of the rally if or when that happens.
What are the important support and resistance levels to watch out for on Bitcoin and the major altcoins? Let’s study the charts of the top 10 cryptocurrencies to find out.
Bitcoin price analysis
Bitcoin broke below the moving averages on May 7 and nosedived to the support line of the symmetrical triangle pattern on May 8. The bulls are trying to defend this level with vigor, but the recovery may face difficulties at higher levels.
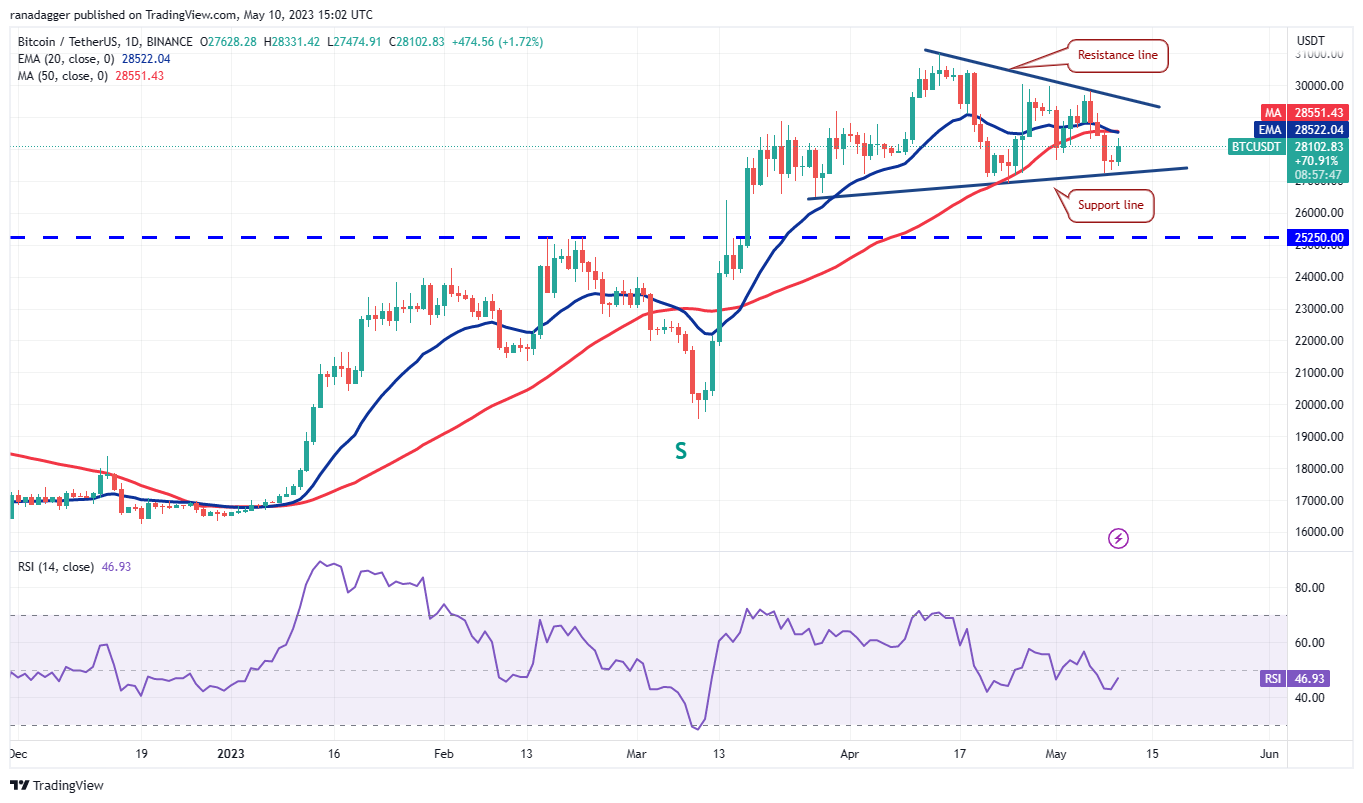
The bears will try to aggressively defend the zone between the moving averages and the resistance line. If the price turns down and breaks below the support line, the BTC/USDT pair could descend to the breakout level of $25,250.
This is an important level to keep an eye on because if it cracks, the selling could intensify and the BTC price can plunge to the psychologically important level of $20,000.
Conversely, if bulls thrust the price above the resistance line, it will suggest that the corrective phase may be over. The pair could first rally to $30,000 and then attempt an up move to $32,400.
Ether price analysis
Ether (ETH) has been stuck between the 20-day exponential moving average (EMA) at $1,887 and the support line for the past two days, but this tight range trading is unlikely to continue for long.
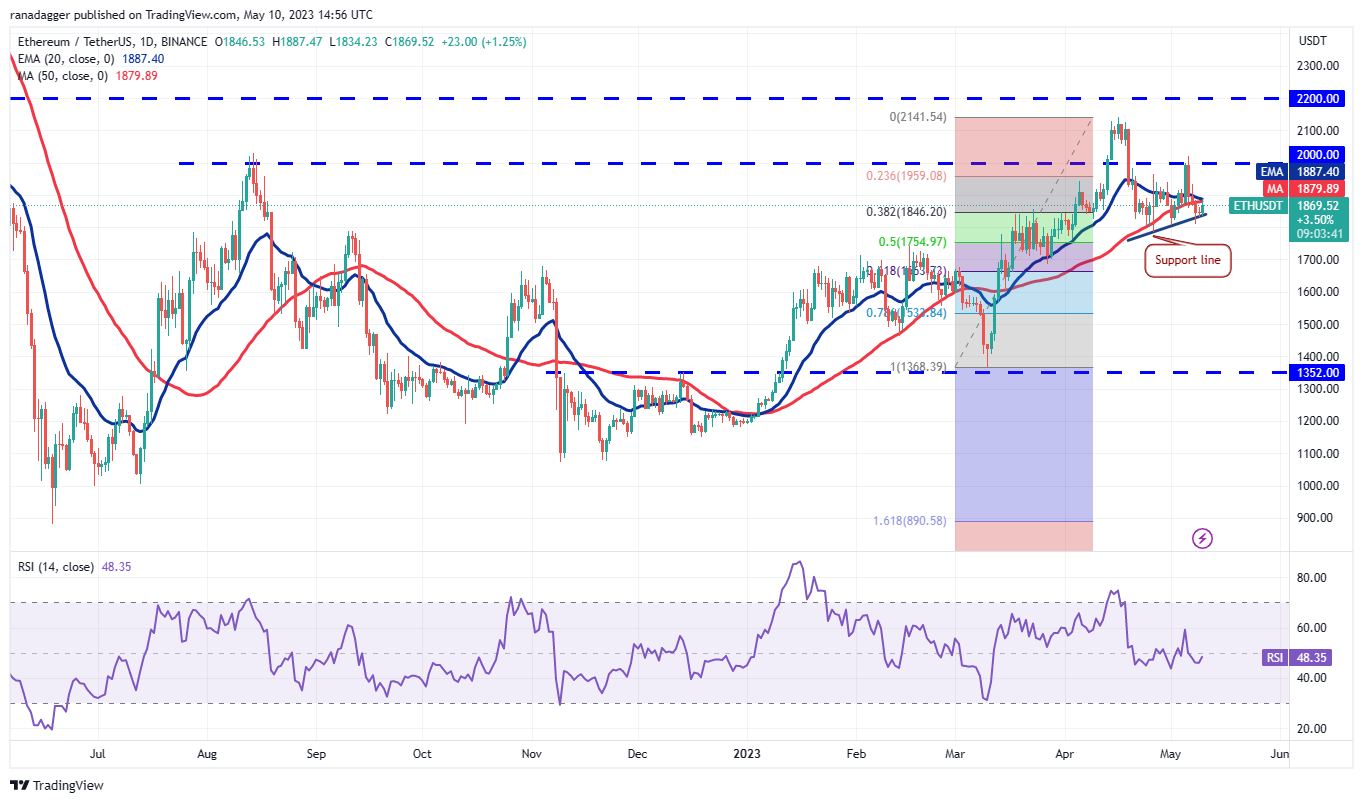
If the price clears the hurdle at the moving averages, it will indicate strong buying at lower levels. The ETH/USDT pair will then try to climb to psychological resistance at $2,000. The bears are expected to fiercely defend this level, but if bulls overcome this barrier, the ETH price may soar to $2,200.
Contrarily, if the price fails to sustain above the moving averages, it will suggest that bears are pouncing on every minor rally. A break below the support line could start a down move that may reach the 61.8% Fibonacci retracement level of $1,663.
BNB price analysis
BNB (BNB) broke below the triangle on May 7, indicating that the uncertainty resolved in favor of the bears.
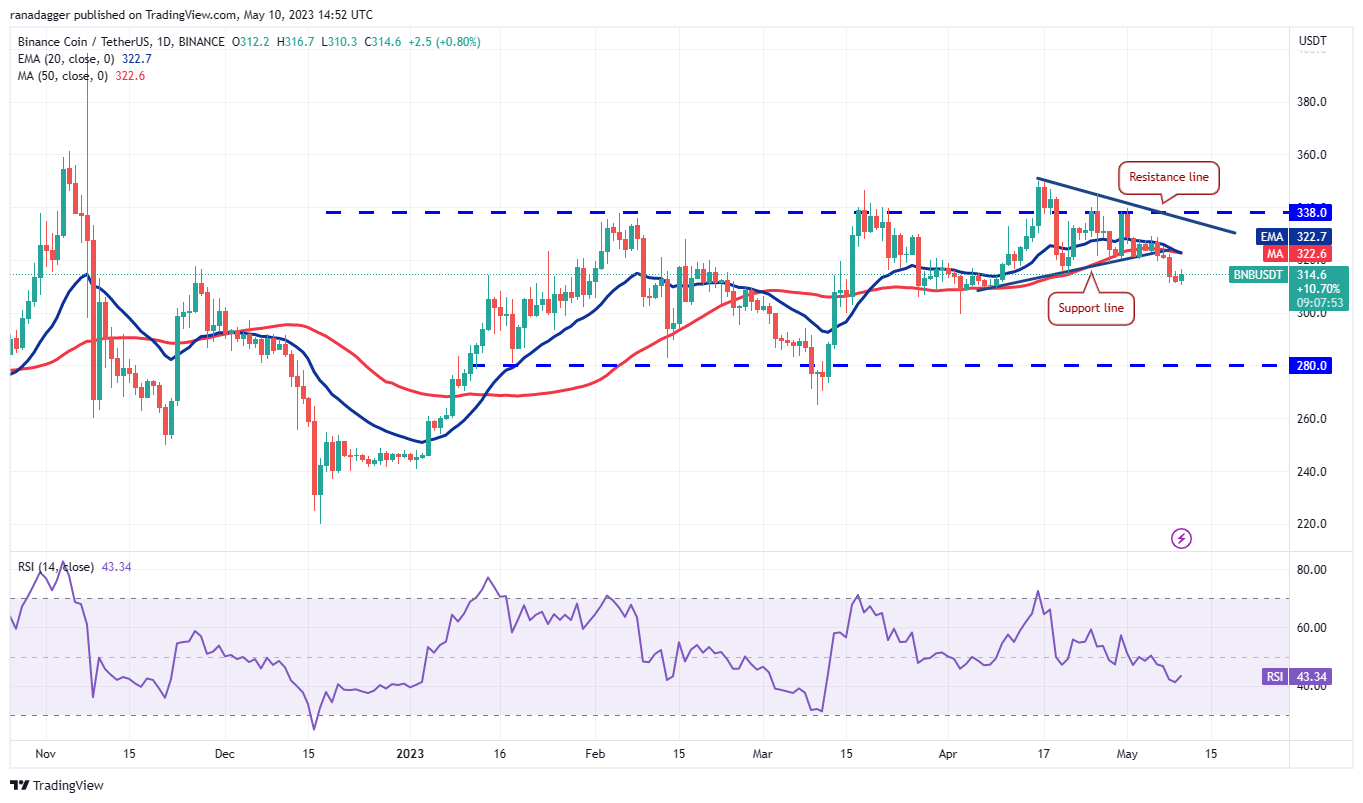
The selling intensified on May 8, and the BNB/USDT pair started its journey toward psychological support at $300. This level may attract buying, which could start a recovery to the 20-day EMA ($322).
If the price turns down from this level, it will enhance the prospects of a break below $300. The next support level is at $280.
If bulls want to prevent the decline, they will have to push the BNB price back above the 20-day EMA. If they are successful, the pair may reach overhead resistance at $338.
XRP price analysis
XRP (XRP) crashed below the $0.43 support level on May 8, but the long tail on the candlestick shows strong buying at lower levels.
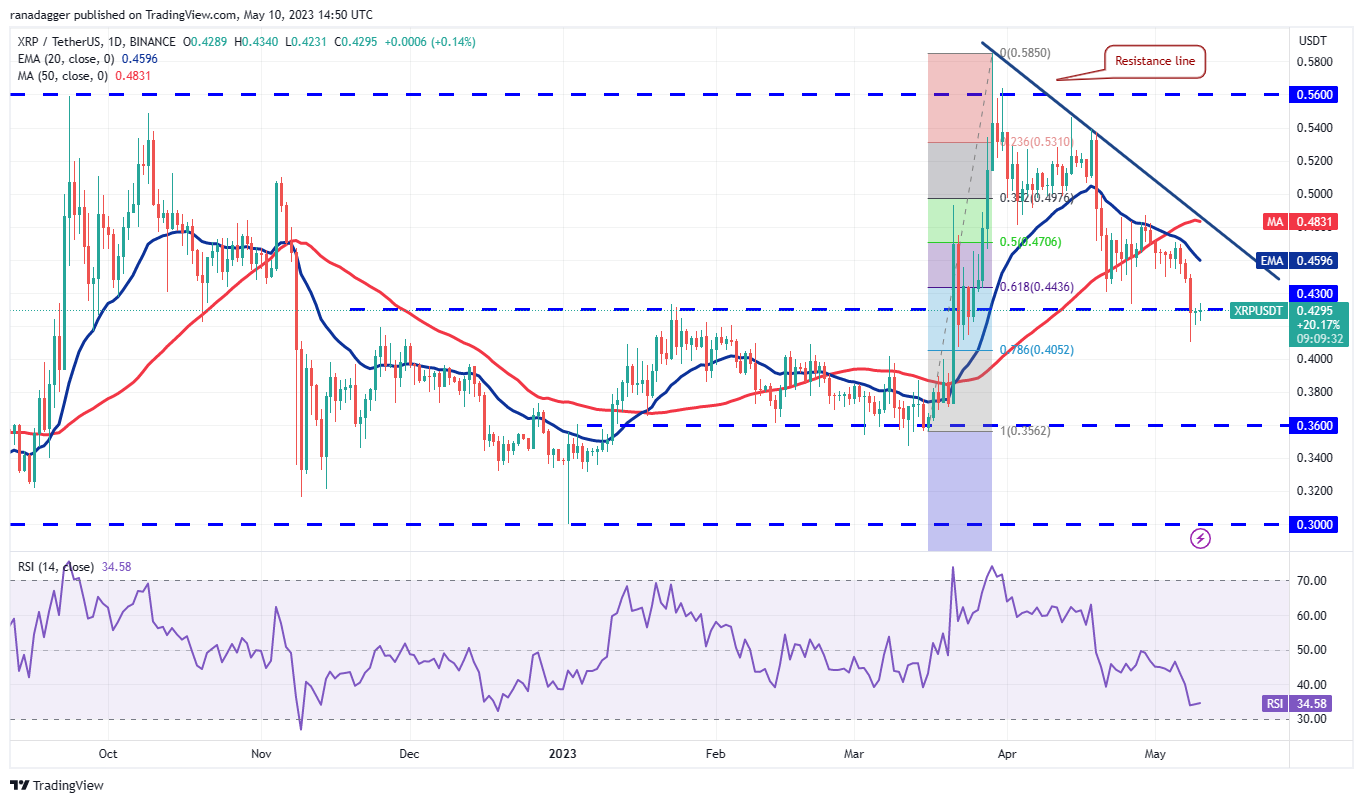
The XRP/USDT pair is showing a tough battle near the breakdown level of $0.43. The bears are trying to flip the level into resistance while the bulls are attempting to push the price above it.
If the XRP price turns down from the current level and breaks below $0.40, the bearish momentum may pick up and the pair could drop to $0.36. This negative view will be invalidated in the short term if bulls kick the price above the resistance line.
Cardano price analysis
Cardano (ADA) plummeted below the $0.37 support level on May 8, indicating that bears are trying to seize control.
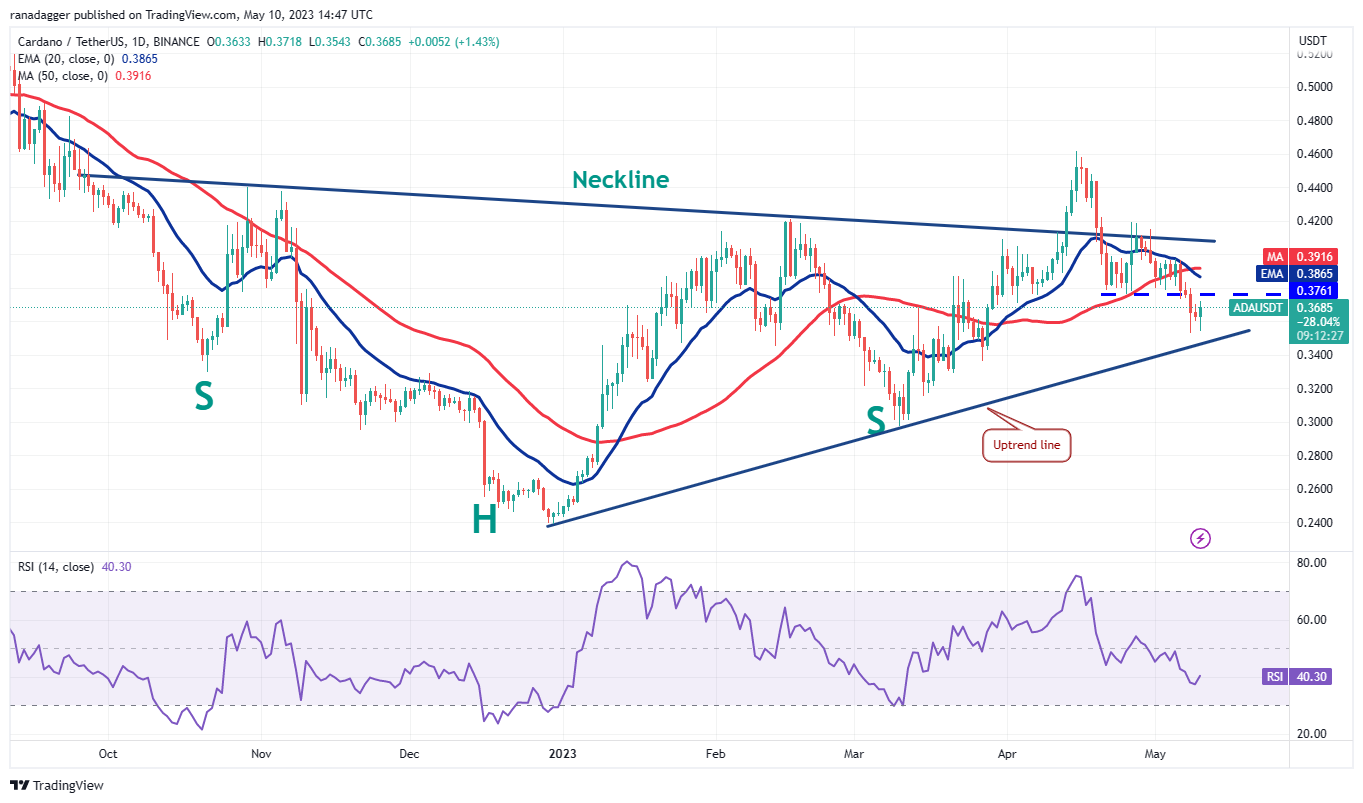
The bulls are trying to stall the decline near the uptrend line, but they are likely to face stiff resistance at the breakdown level of $0.37. If the price turns down from this level, it will suggest that the bears have flipped $0.37 into resistance.
That will enhance the prospects of a break below the uptrend line. The ADA/USDT pair may then start its decline to $0.33 and later to $0.30. The first sign of strength will be a break and close above the moving averages. That will open the doors for a rally to $0.42.
Dogecoin price analysis
Dogecoin (DOGE) continued its downward journey and touched the solid support level of $0.07 on May 8. The bulls are trying to achieve a bounce off this level.
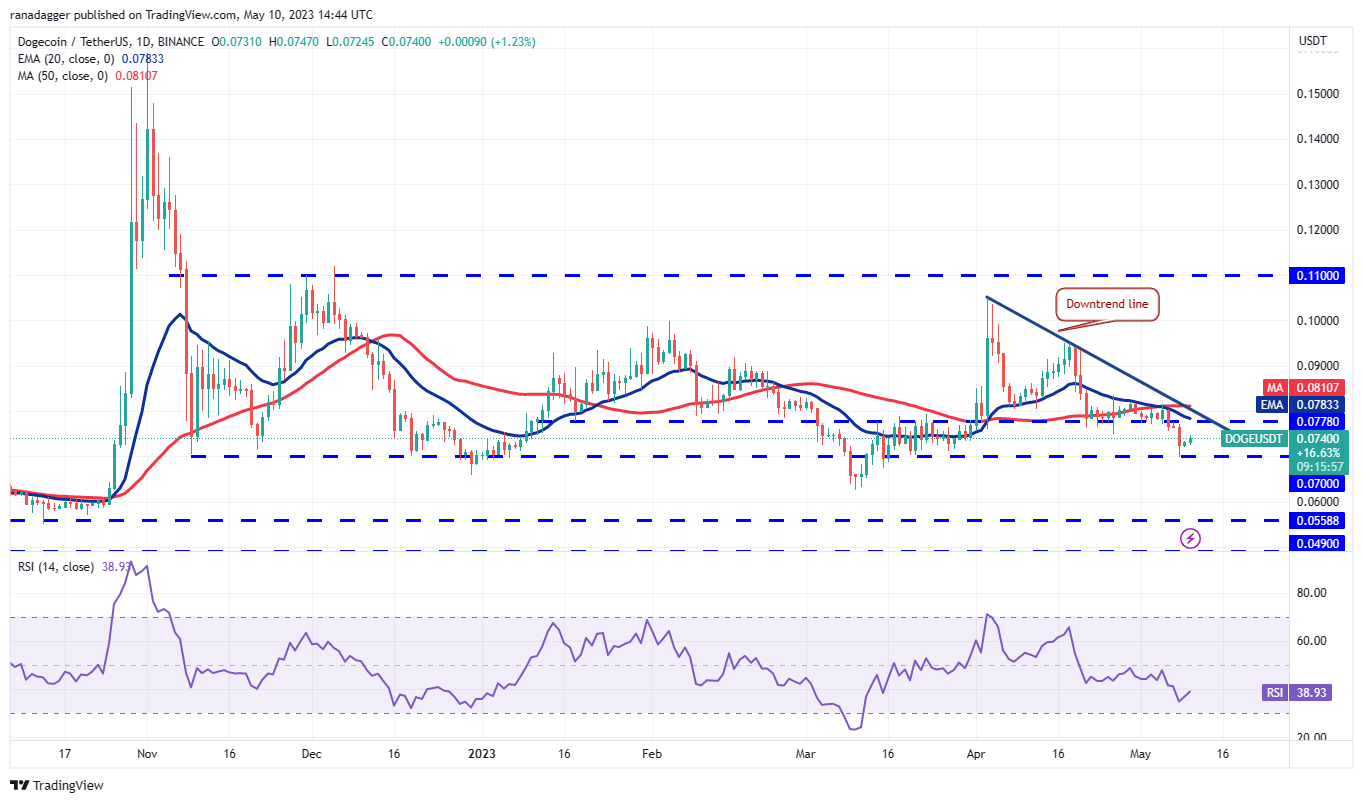
The relief rally is likely to reach the downtrend line, where the bears are expected to mount a strong defense. If the price turns down from this level, the bears will again try to sink the DOGE/USDT pair below the support level of $0.07. If they succeed, the pair may plunge to $0.06, which is not major support. If this level gives way, the pair may collapse to $0.05.
Conversely, if buyers thrust the price above the downtrend line, it will signal the start of a stronger recovery. DOGE’s price may then rise to the overhead resistance zone of $0.10 to $0.11.
Polygon price analysis
Polygon (MATIC) nosedived below the vital support level of $0.94 on May 8, indicating that the bears are in command.
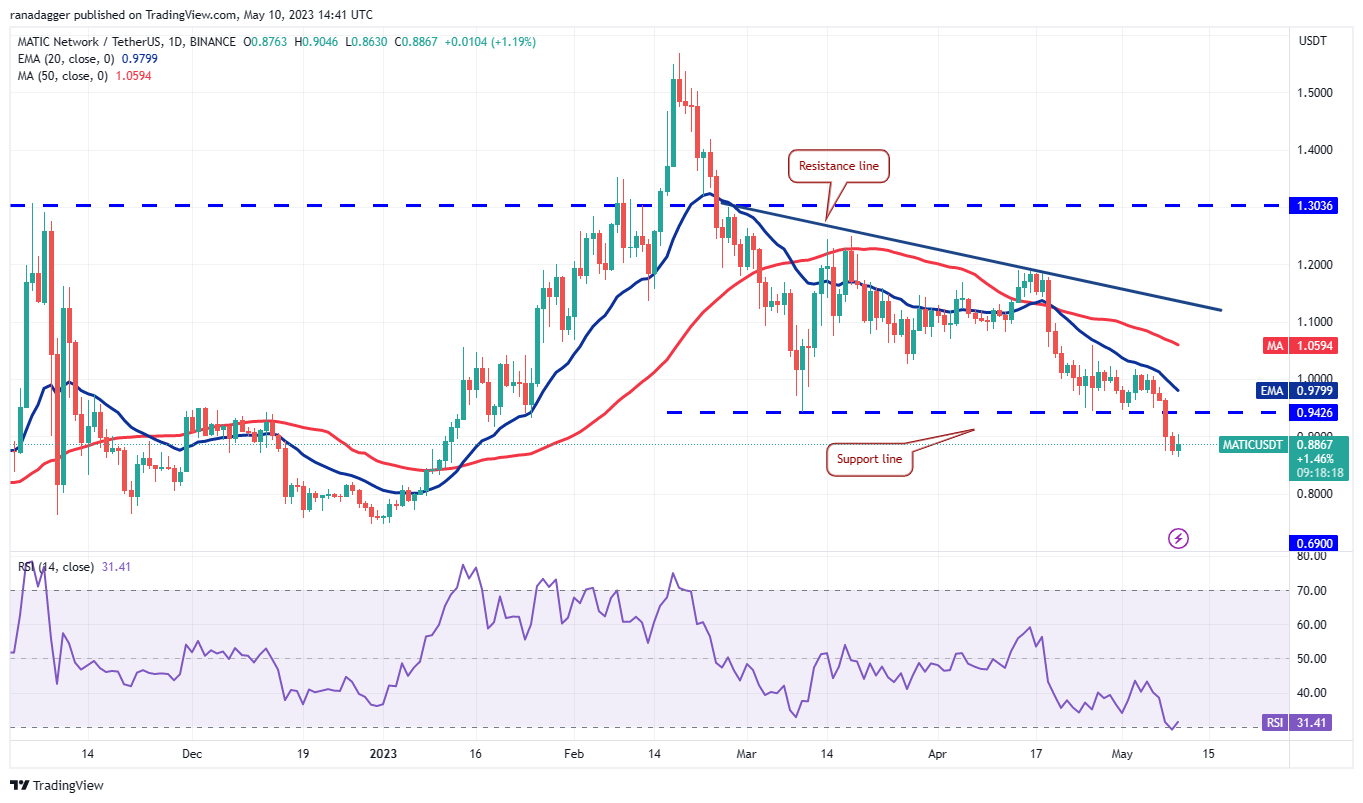
The sharp fall of the past few days pulled the relative strength index (RSI) into oversold territory, suggesting that a recovery is possible. The sellers will try to pounce on any relief rally and keep the price below the $0.94 level. If they do that, the MATIC/USDT pair could start its journey toward the strong support level of $0.69.
Contrarily, a break and close above the 20-day EMA ($0.98) will suggest that lower levels are attracting solid buying. That may trap several aggressive bears and propel the MATIC price toward the resistance line.
Related: Pepe vs. Doge: How memecoins performed first time hitting $1B market cap
Solana price analysis
Solana (SOL) turned down from the downtrend line on May 6 and fell to the strong support level of $19.85 on May 8.
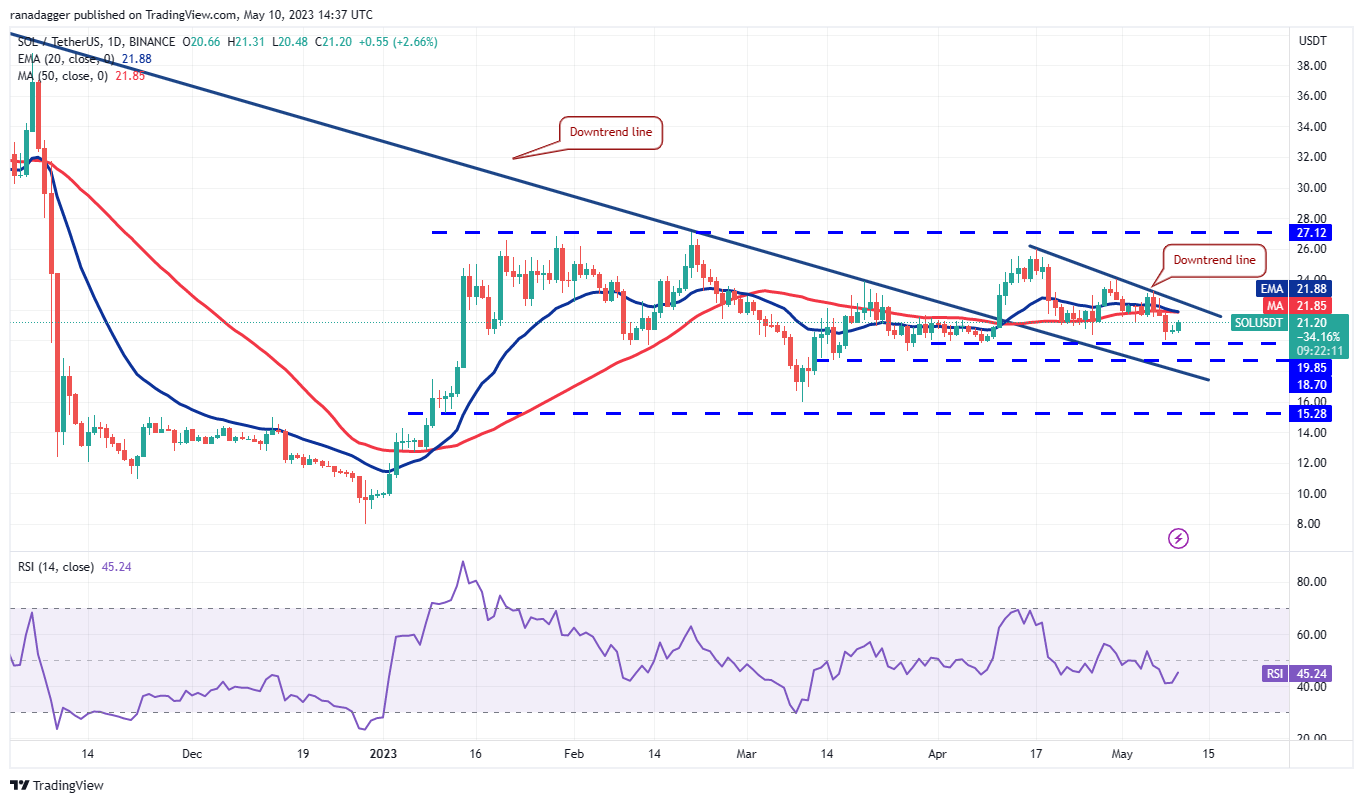
The bulls are trying to start a recovery, but the rebound lacks conviction. If Solana’s price turns down from the current level and plunges below $19.85, the SOL/USDT pair may fall to $18.70. This level may again act as strong support.
If bulls want to prevent a decline, they will have to quickly drive the price above the downtrend line. If they manage to do that, SOL’s price could rise to $24 and subsequently to the overhead resistance level of $27.12.
Polkadot price analysis
The bulls are trying to protect the strong support level of $5.15 as seen from the long tail on Polkadot’s (DOT) May 8 candlestick.
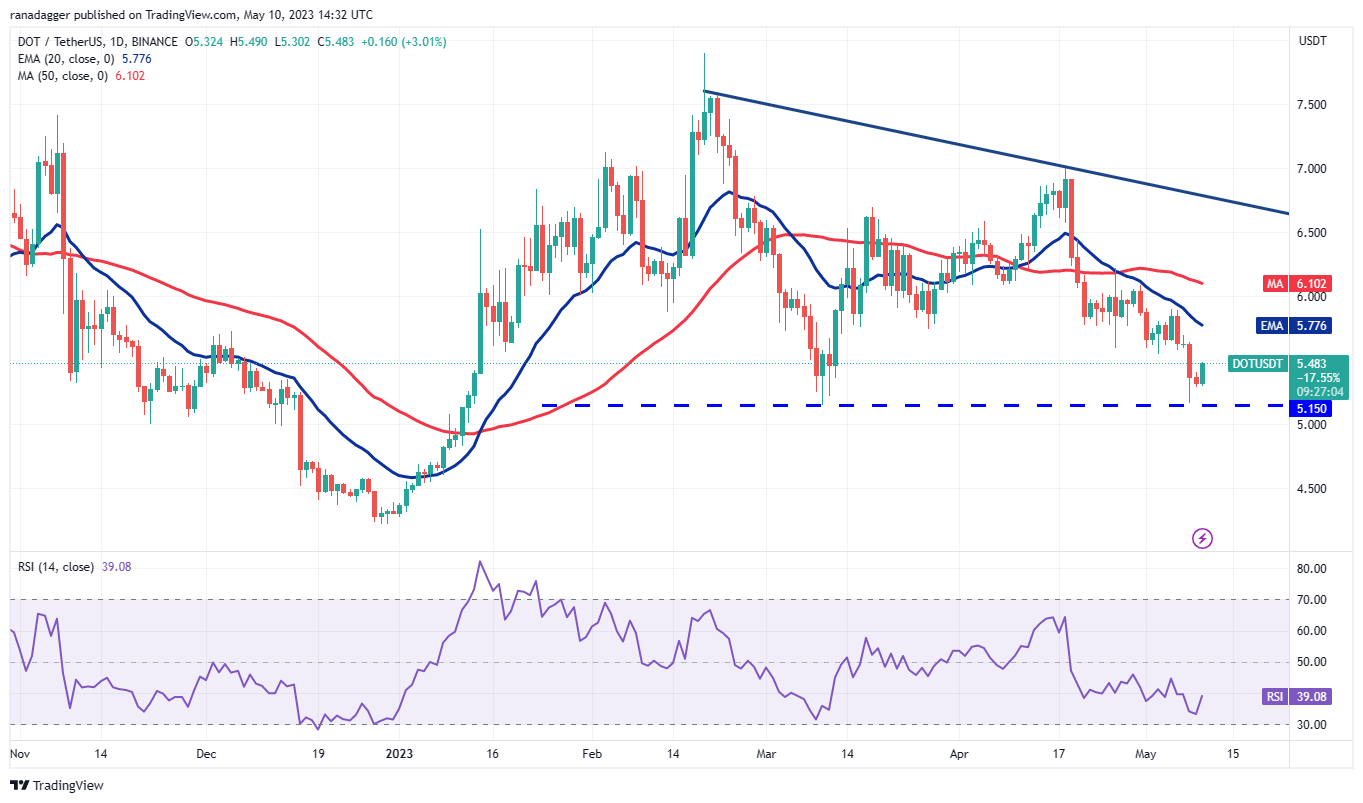
The recovery is likely to face stiff resistance at the 20-day EMA ($5.77), as the bears have been guarding this level with vigor. If the price turns down from the current level or the 20-day EMA, the bears will make another attempt to sink the DOT/USDT pair below $5.15. If they can pull it off, Polkadot’s price risks a drop to $4.50.
Contrarily, if the relief rally pierces the 20-day EMA, DOT’s price may rise to the 50-day simple moving average (SMA) at $6.10 and later reach the downtrend line. A break and close above this level will suggest that the bulls are on a comeback.
Litecoin price analysis
Litecoin (LTC) rebounded off the crucial support level of $75 on May 8, indicating that the bulls are trying to arrest the decline at this level.
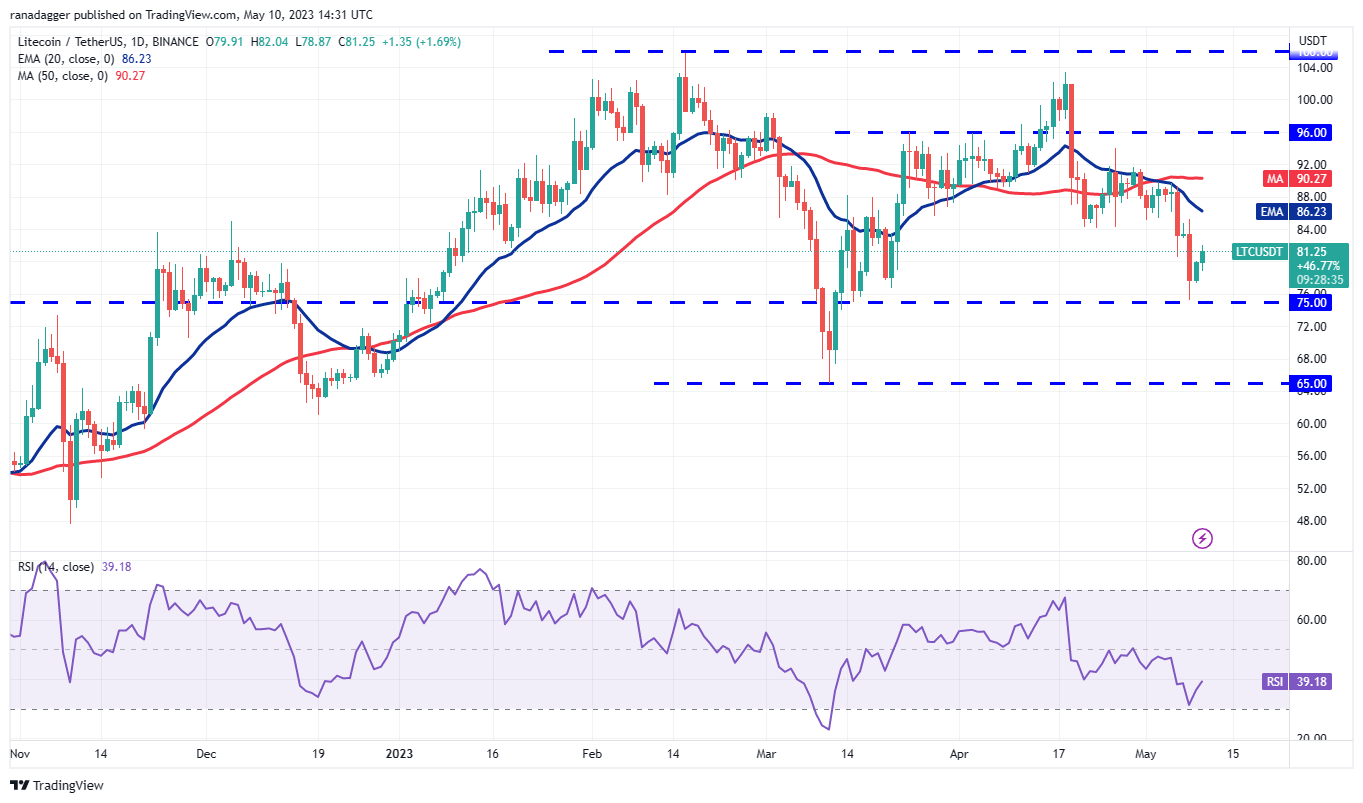
A downsloping 20-day EMA ($86) and an RSI in negative territory indicate that bears are in command. Any recovery attempt is likely to face selling at the 20-day EMA. If Litecoin’s price turns down from this level, it will increase the likelihood of a break below $75. If that happens, the LTC/USDT pair could tumble to $65.
Contrary to this assumption, if bulls drive LTC’s price above the 20-day EMA, it will suggest that bearish pressure is reducing. The pair may first recover to the 50-day SMA ($90) and thereafter dash toward $96.
This article does not contain investment advice or recommendations. Every investment and trading move involves risk, and readers should conduct their own research when making a decision.

