Polkadot has been on a sharp decline over the last week as the broader market extended losses at press time.
Bitcoin nosedived to $28,000 and presented a loss of 7% over the last 24 hours. All major altcoins have followed the same path registering losses on the daily chart.
Polkadot was trading in a descending trendline, although, DOT tried to recover on charts. The recovery can be stalled if buyers don’t return to the market.
The price of the altcoin was trading close to its immediate support of $8.04.
DOT was last seen trading around this price last in July 2021. In the last four months, Polkadot displayed rangebound rallies.
The price of DOT was sandwiched between $24 and $16 over the last 17 weeks. Although Polkadot staged a revival, it is too early to conclude if the coin will continue to move northbound.
Polkadot Price Analysis: One Day Chart
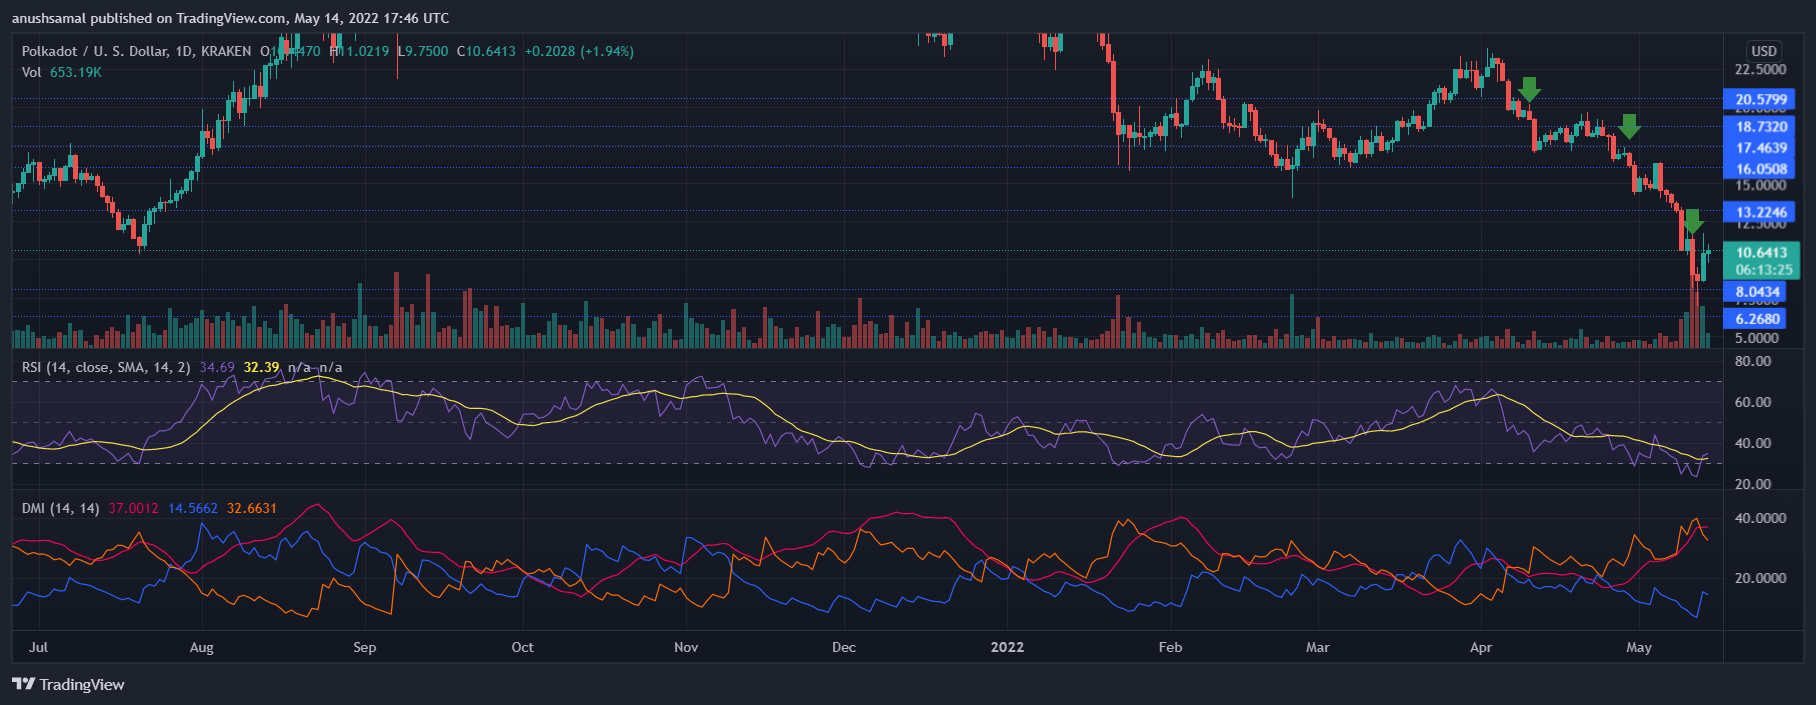
Polkadot was trading at $10.64 at the time of writing. In the last 24 hours, DOT lost over 12% and in the past week, the coin lost close to 30% of its market value.
Descending trendline depicts bearishness, even though the coin was attempting to rise above the immediate resistance line of $10.80.
Moving above the $10.80 price level, the coin could target $13.22. To invalidate the bearish thesis the coin has to trade above the $14 price level.
The coin displayed a series of bearish engulfing candlesticks (green arrow) on the one day chart.
The bearish engulfing candlesticks mark the onset of bearish price action and the continuation of the same.
In case of a price reversal, if the coin manages to stay above the $13.22 price level, then the other two resistance for DOT stands at $16.06 and $17.46, respectively.
The trading volume of the coin was seen in the green. This meant that the coin was displaying a change in price direction.
Technical Analysis

Polkadot was oversold over the past few days, however, the coin started to register an increase in buying strength.
The Relative Strength Index noted an uptick on the one day chart. The RSI moved above the oversold zone as buyers started to enter the market.
Buying pressure remained low in the market as the coin’s price was still driven by sellers in the market, despite the uptick. The Directional Movement Index depicts the price momentum in the market.
DMI was negative on the chart as the -DI was above the +DI line which signified bearish price action.
Related Reading | XRP Flashed A Sign Of Revival; Where’s It Headed Next?

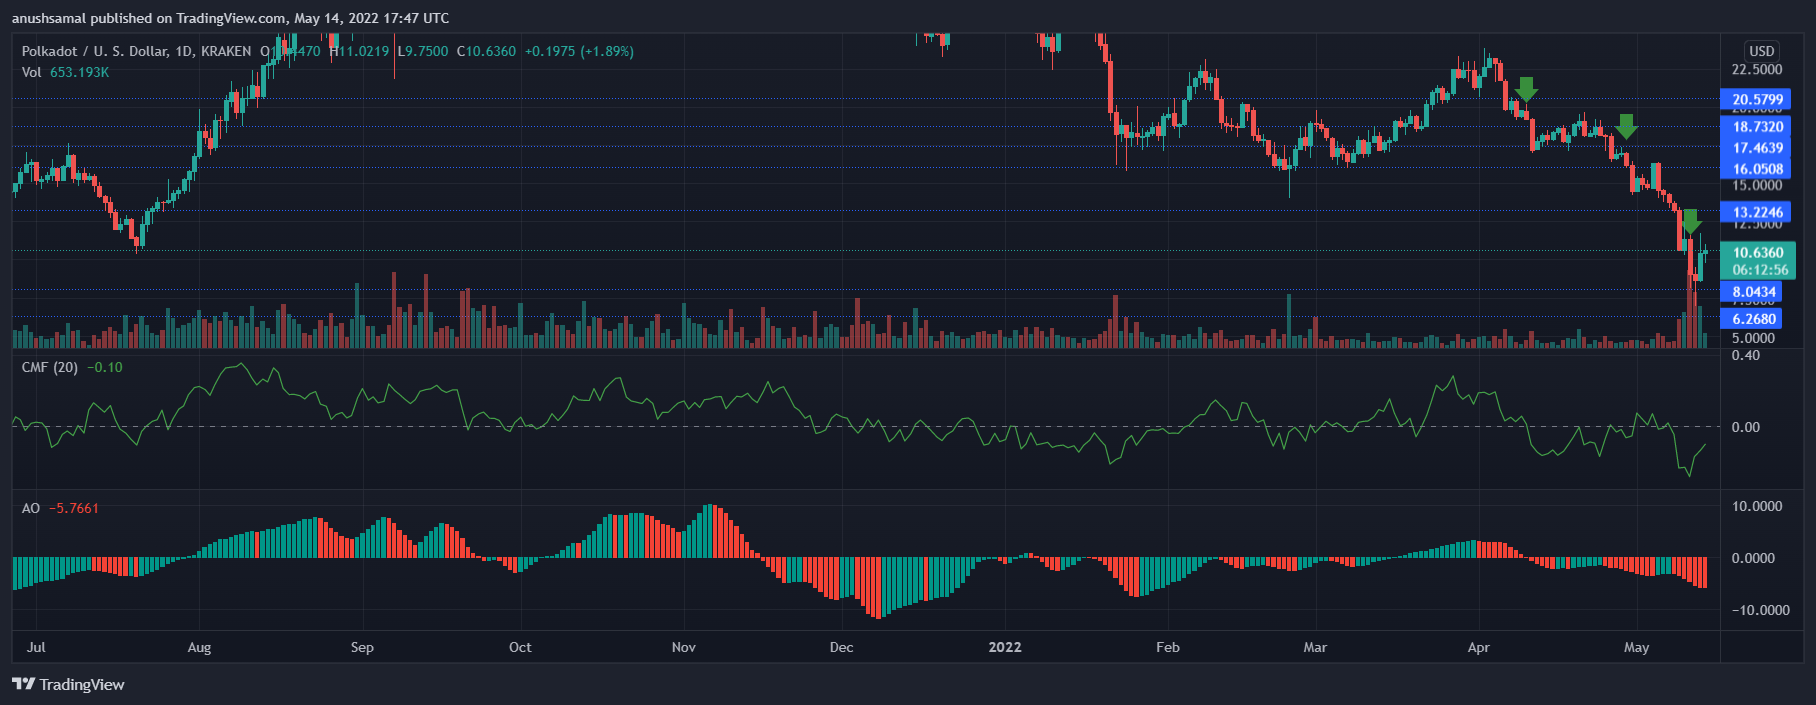
Polkadot was trying to recover on its chart because the indicators have reflected that price action. Chaikin Money Flow portrays the capital outflows and inflows.
On the one day chart, Chaikin Money Flow was seen registering an uptick that points towards increase in capital inflows over outflows.
Awesome Oscillator signifies price momentum of the market. The AO continued to flash red histograms underneath the half line which meant that Polkadot was still on a negative price direction.
Related Reading | Bitcoin Recovers Above $30,000, Has The Bottom Been Marked?


