MATIC price had been on a bearish trajectory for the past few days. Over the last week, the coin hasn’t made any progress in terms of price appreciation. In the last 24 hours however, MATIC registered a 2% increase in its market value.
Currently Polygon MATIC price is slightly underneath the $1 price mark. Price of MATIC has been stuck below the $1 mark for months now, every time the bulls start to pick up momentum, the coin was met with selling pressure.
For MATIC to invalidate the bearish thesis completely, it is important that the coin trades above the $1 mark for a considerable duration. Technical outlook for the coin has turned positive however, this positive reading could soon lose steam if buying strength doesn’t remain consistent over the next trading sessions.
At the current moment, MATIC has registered increased number of buyers compared to sellers. MATIC price still has to encounter a tough resistance at the $1 mark. The coin hasn’t been able to break past that resistance for months now. A small decline in price would push MATIC price to $0.74 before another potential rally.
MATIC Price Analysis: Four Hour Chart
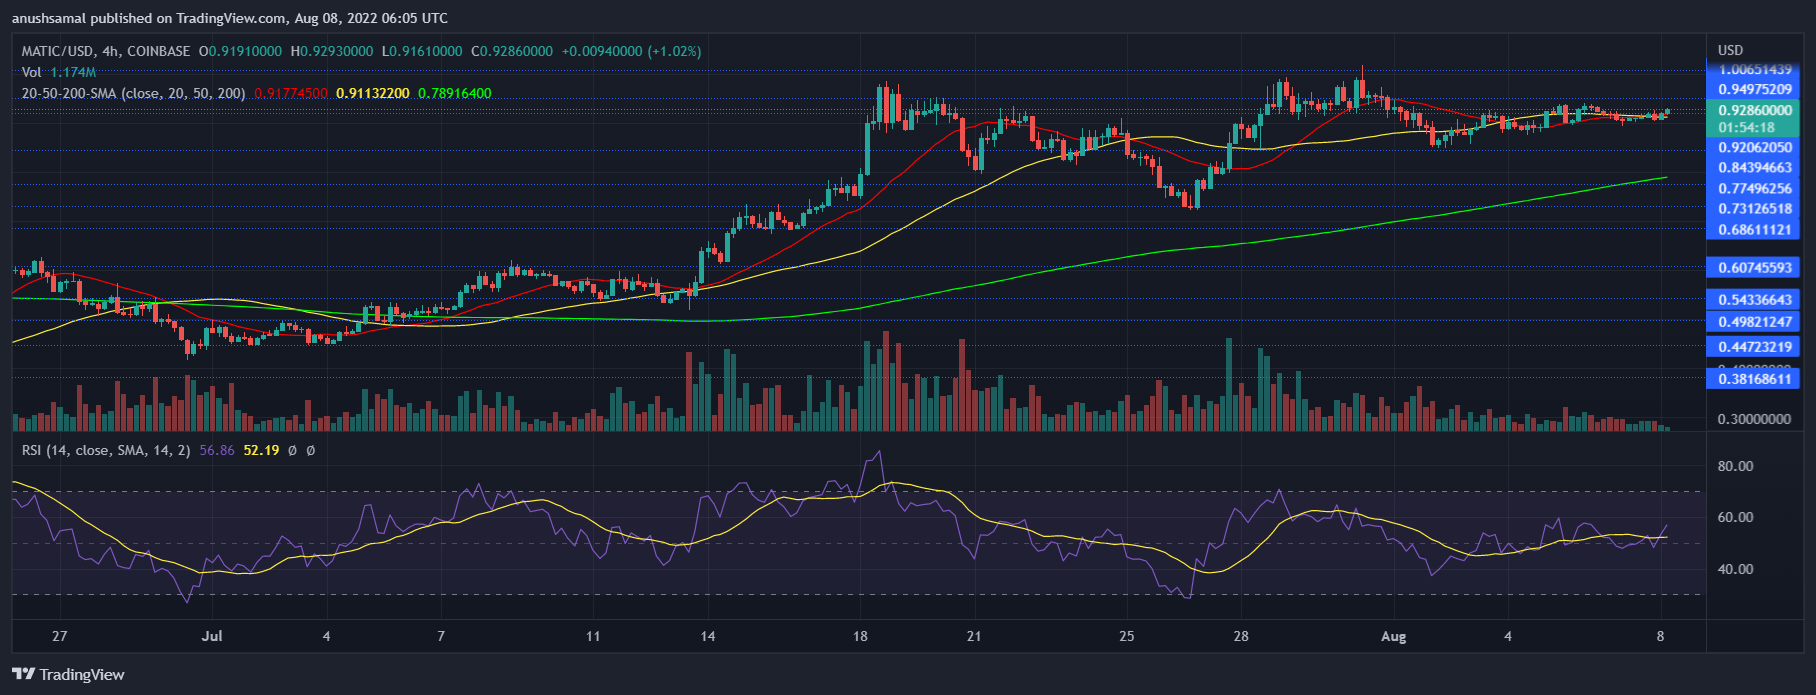
The price of the altcoin was $0.92 at the time of writing. MATIC price was trading close to its $1 price mark, the bulls tried to push price towards the $1 mark at the end of last month but it was invalidated by sellers in the market. A strong overhead resistance for MATIC was at $1.
A fall from the present price level will drag the altcoin down to $0.73 and then eventually to $0.68. Amount of MATIC traded in the past session fell on the chart. This reading is tied to a fall in selling strength for the altcoin in the market.
Technical Analysis

Polygon’s MATIC price had registered a substantial recovery since the middle of last month. Despite the recovery, MATIC had visited the oversold territory once and had also registered increased number of sellers compared to buyers.
At press time however, buying strength remained more than selling pressure.
The Relative Strength Index was placed slightly above the half-line indicating bullishness as buyers exceeded sellers.
MATIC price was above the 20-SMA line. Price of the altcoin also managed to move above the 50-SMA. Both these observations point towards buyers driving the price momentum in the market.

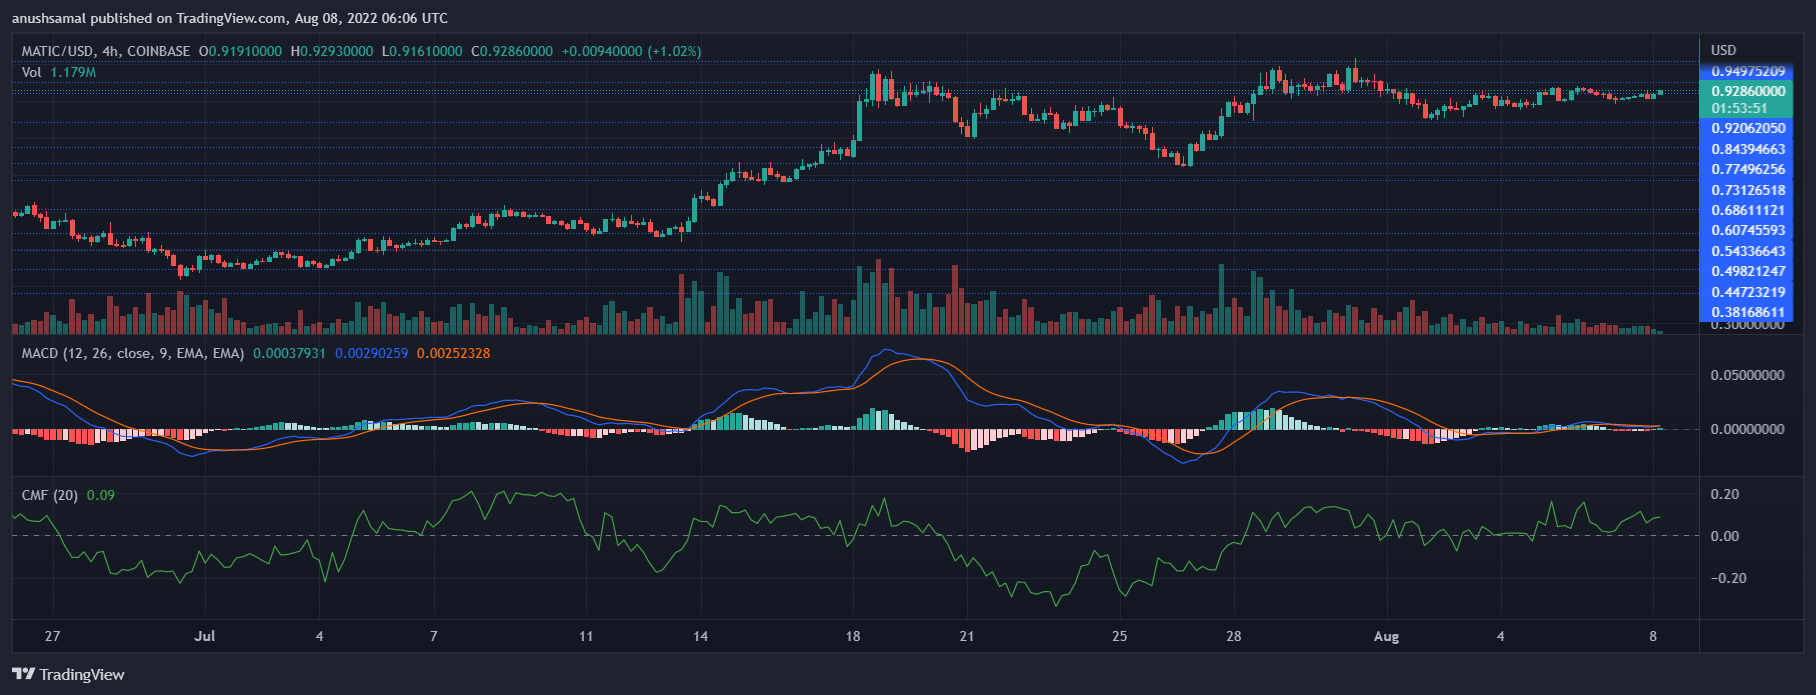
The altcoin has managed to paint mixed technical signals. MATIC captured sell signal on its four-hour chart. Moving Average Convergence Divergence depicts the price momentum and trend reversal.
The indicator despite a minor price appreciation underwent a bearish crossover and flashed red signal bars. The red signal bars are an indication of sell signal on the chart.
Chaikin Money Flow is responsible in determining capital inflows and outflows.
CMF stood above the half-line, into the positive zone as the coin registered increased amount of capital inflows than outflows. For MATIC to soar past the $1, broader market strength and buying pressure will be required.
Featured image from The Face and chart from TradingView.com


