Litecoin price crossed $94 on March 3, its highest since the widespread post-halving sell-off in August 2023, which has seen LTC underperform the market in the last 6-months.
A widespread post-halving sell-off saw Litecoin price dip 37% within a fortnight of the critical network event. Since then, Litecoin price has struggled for upward momentum. Bullish moves observed among LTC whale investors this week suggest this is about to change.
Post-halving sell-off saw Litecoin price struggle for momentum
Litecoin’s most recent halving event went live on August 2, 2023, reducing the block reward from 12.5 LTC to 6.25 LTC.
In the weeks that followed, LTC experienced a major sell-off from miners and institutional investors, which sent prices spiraling from $95 on the halving date, to a multi-year low of $58 by Aug. 17.
The crypto sector rally began in mid-October, but the post-halving dearth in demand saw LTC price trailing the market, as Litecoin price remained sandwiched within the $70 – $80 range for the better part of the last 6 months.
However, recent market data suggests that Bitcon halving could have a reverse impact on LTC price action.
Litecoin whale holdings nears 34.4M all-time high ahead of Bitcoin halving
With the Bitcoin (BTC) halving estimated to go live on April 19, now less than 2-months away, rival Proof of Work (PoW) networks including Bitcoin Cash (BCH) and Kaspa (KAS) have all recorded significant growth.
This comes amid widespread speculation that miners and key stakeholders who find BTC less profitable could be incentivized to channel their resources towards other PoW networks.
On-chain movements observed among LTC institutional investors this week suggest this bullish outlook could already be in play for LTC price.
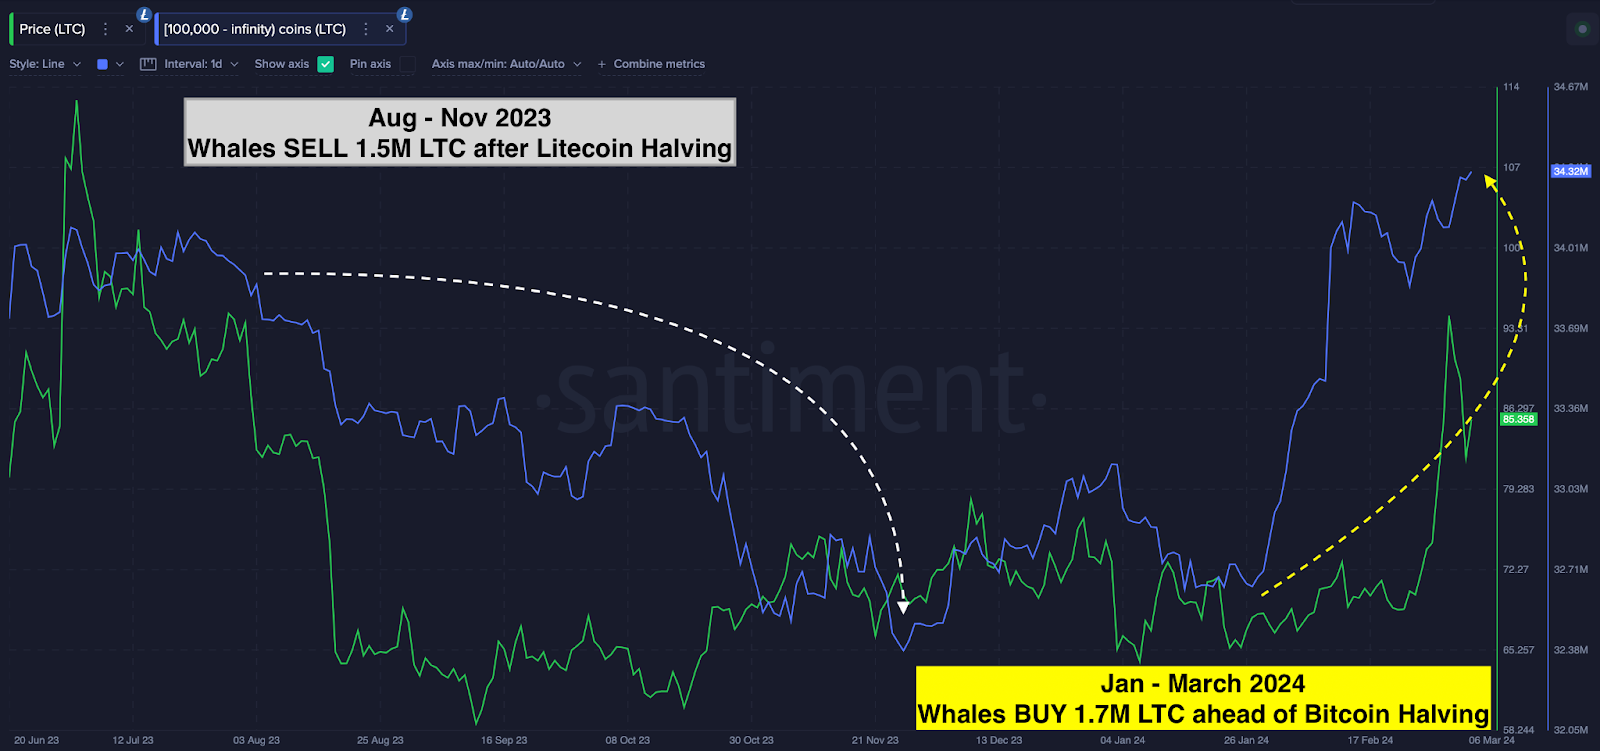
The Santiment chart below represents historical trends of balances in whale wallets with a minimum of 100,000 LTC (~$8.5 million). As seen below, the LTC whales entered a selling spree after the halving, depleting their balances by more than 1.2 million LTC over the next 5 months.
However the pendulum swung in recent weeks, as the whales started buying again around Jan 27.

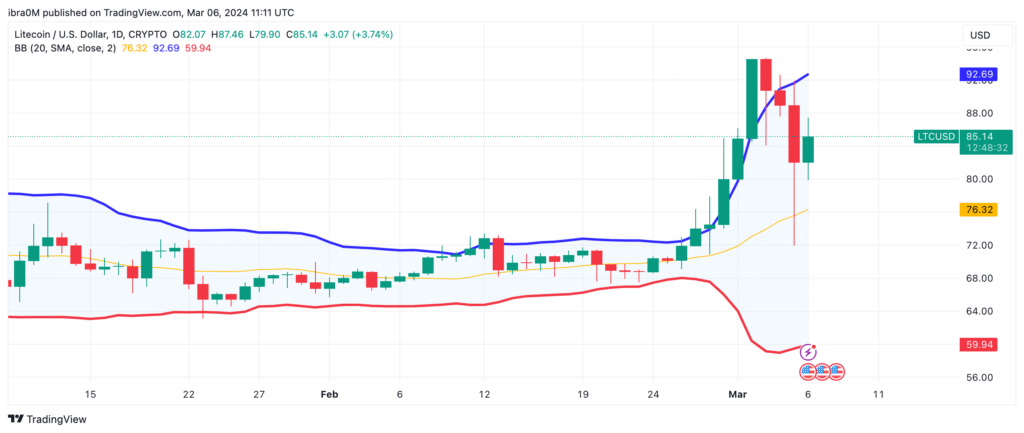
Litecoin surged 28% in a frenetic 48 hour rally between Feb. 29 and March 2. LTC price finally reclaimed $95 for the first time since the halving, before a sharp retracement saw LTC find support at the $85 at press time on March 6.
Whale investors returning to the Litecoin network are the main catalysts behind the current LTC price resurgence.
The chart above illustrates how the whales have acquired 1.7 million LTC between Jan 27 and March 5, bringing their balances to 34.4 million LTC, just 40,000 shy of their all-time high holdings.
On-chain movements from this cohort of whales has proven highly influential on LTC price movements. Notably, the chart shows that following Aug. 2 halving event, the whales offloaded a whopping 1.5 million LTC over a period of 5 months, which conceded with LTC price falling to a multi-year low, and underperforming amid the market rally.
However, as things stand, the whales have now increased their holdings to historic levels, signaling overwhelming bullish conviction that the Bitcoin will impact LTC prices positively.
LTC price prediction: Can it reach $100 again?
Valued at the current prices of about $85 per coin, the whales have now invested over $228 million in Litecoin since the buying trend began around Jan. 27. And if the historical patterns are anything to go buy, LTC could be on the verge of another major price breakout above $100 as the BTC halving draws nearer.

But in terms of short-term price action, the upper Bollinger band technical indicator currently highlights the $93 area as the major resistance level. If the bulls can establish a steady support level above that critical price point, a major breakout above $100 could be on the cards as predicted.
On the flip side, the bulls can rely on the 20-day SMA at $76.3 for initial support, in the event of dramatic bearish reversal.


