

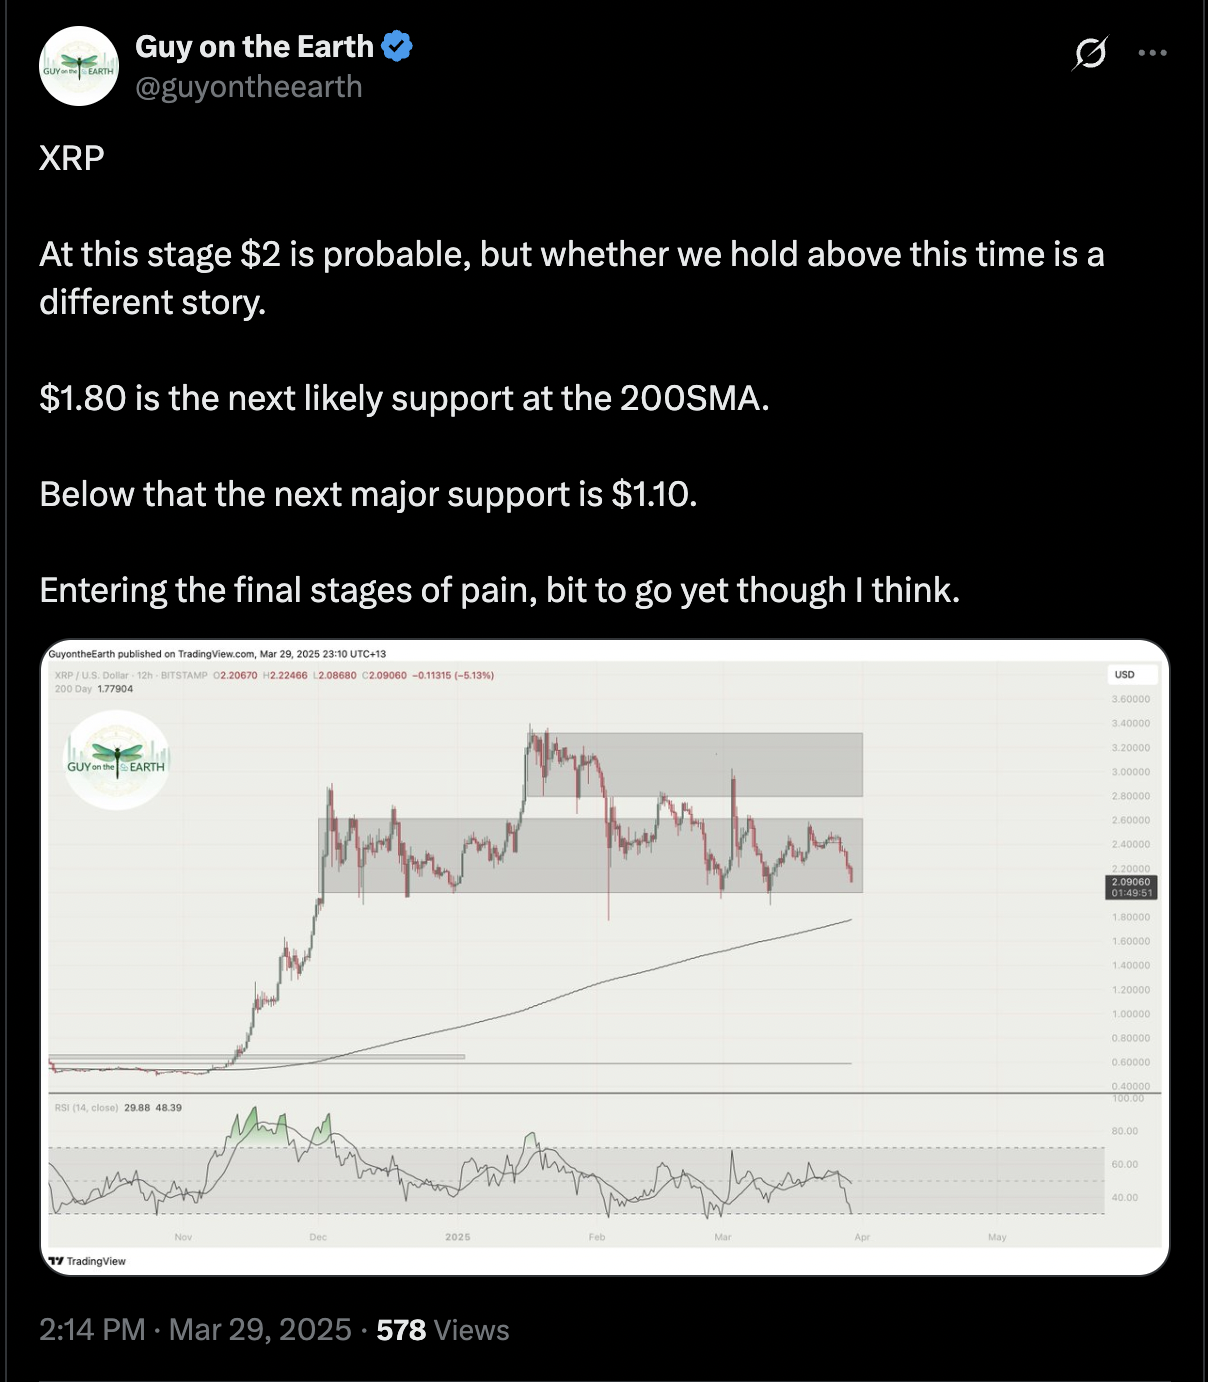
XRP (XRP) has dropped nearly 40% to around $2.19, two months after hitting a multi-year high of $3.40. The cryptocurrency is tracking a broader market sell-off driven by President Donald Trump’s trade war despite bullish news like the SEC dropping its case against Ripple.
XRP/USD daily price chart. Source: TradingView
However, XRP is still up 350% from its November 2024 low of $0.50, suggesting a consolidation phase after a strong rally. This sideways action has sparked discussions over whether it’s the end of the bull run or a prime buying opportunity.
No buying opportunity until XRP falls further
XRP has been consolidating between $1.77 (support) and $3.21 (resistance) since January, with repeated rejections near the top of the range and fading bullish momentum.
According to analyst CrediBULL Crypto, XRP’s recent bounce attempt stalled below $2.20, reinforcing bearish control. He now expects the price to revisit the range lows around $1.77 for a potential long entry.
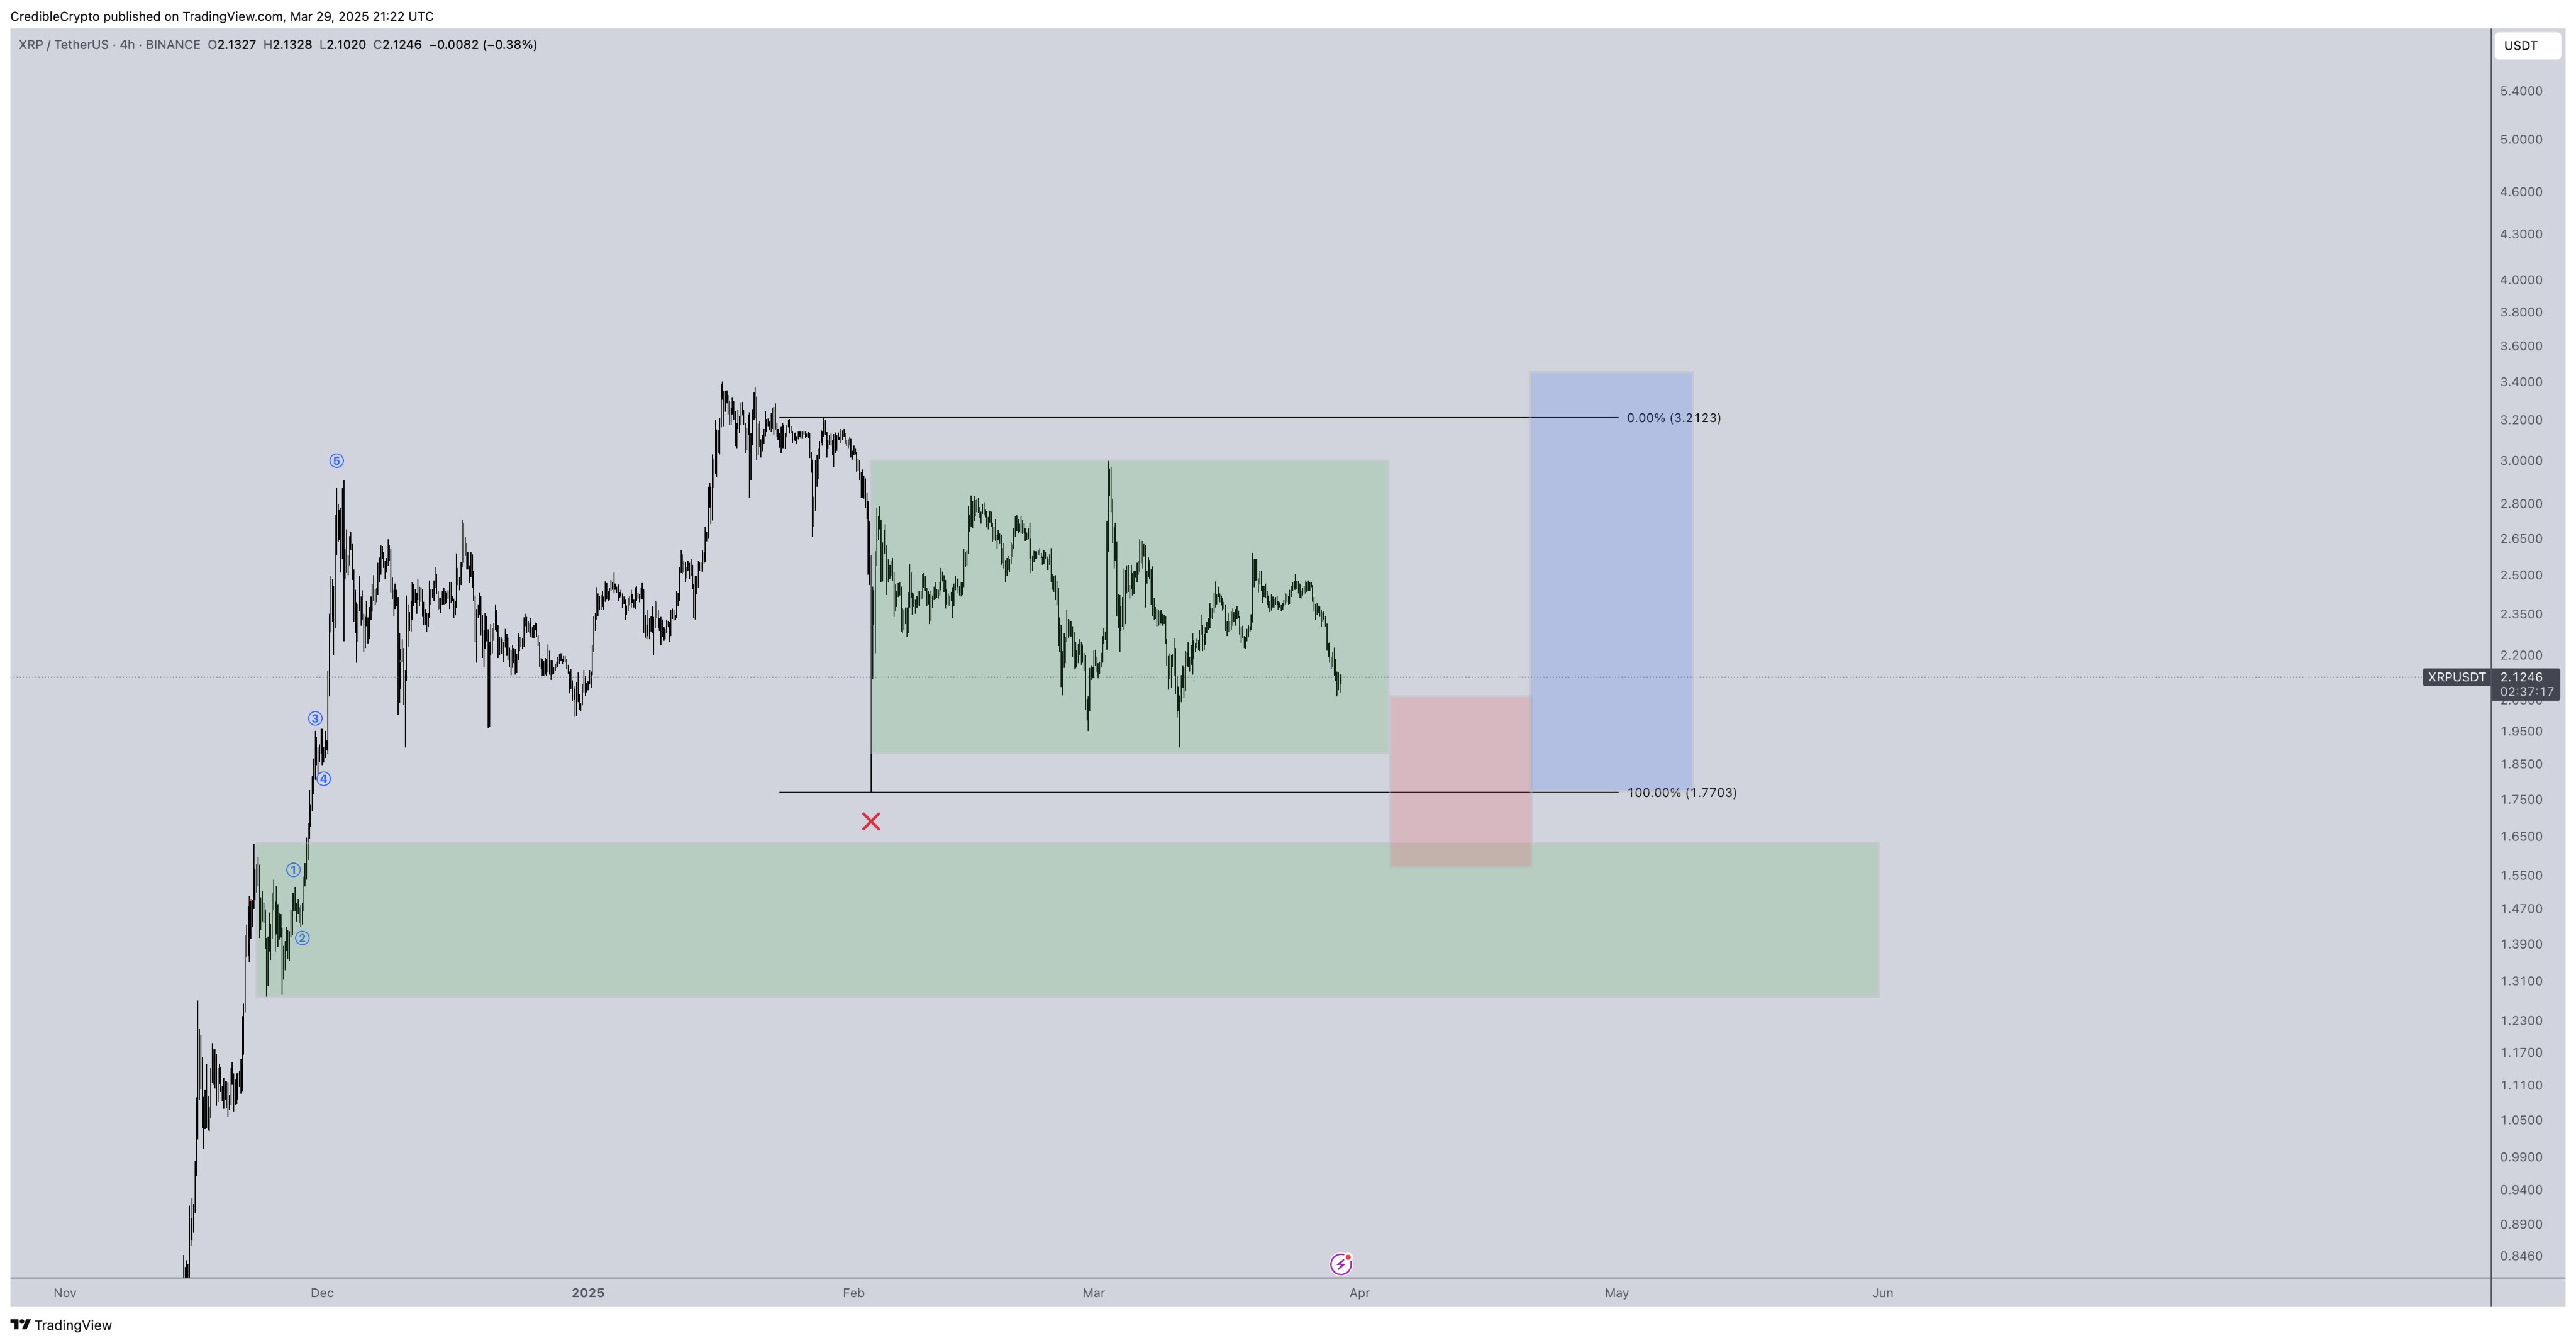
XRP/USD four-hour price chart. Source: TradingView
The rectangle-shaped green support area on the chart extends as low as $1.50, signaling a high-demand zone where bulls could step in.
A short-term marketwide bounce—led primarily by Bitcoin (BTC)—could trigger a temporary recovery, argues CrediBULL, emphasizing that only a clean breakout above $3.21 would confirm a bullish trend reversal.
Until then, XRP remains in a sideways structure, with CrediBULL’s strategy focused on watching for reactions at the $1.77 support level before committing to a long position.
Source: X
XRP bull flag may lead to 450% price rally
CrediBULL highlighted XRP’s sideways range between $1.77 and $3.21 as a consolidation zone, waiting for a clear breakout to confirm the next trend. Interestingly, that very range may be forming a bull flag, according to analyst Stellar Babe.
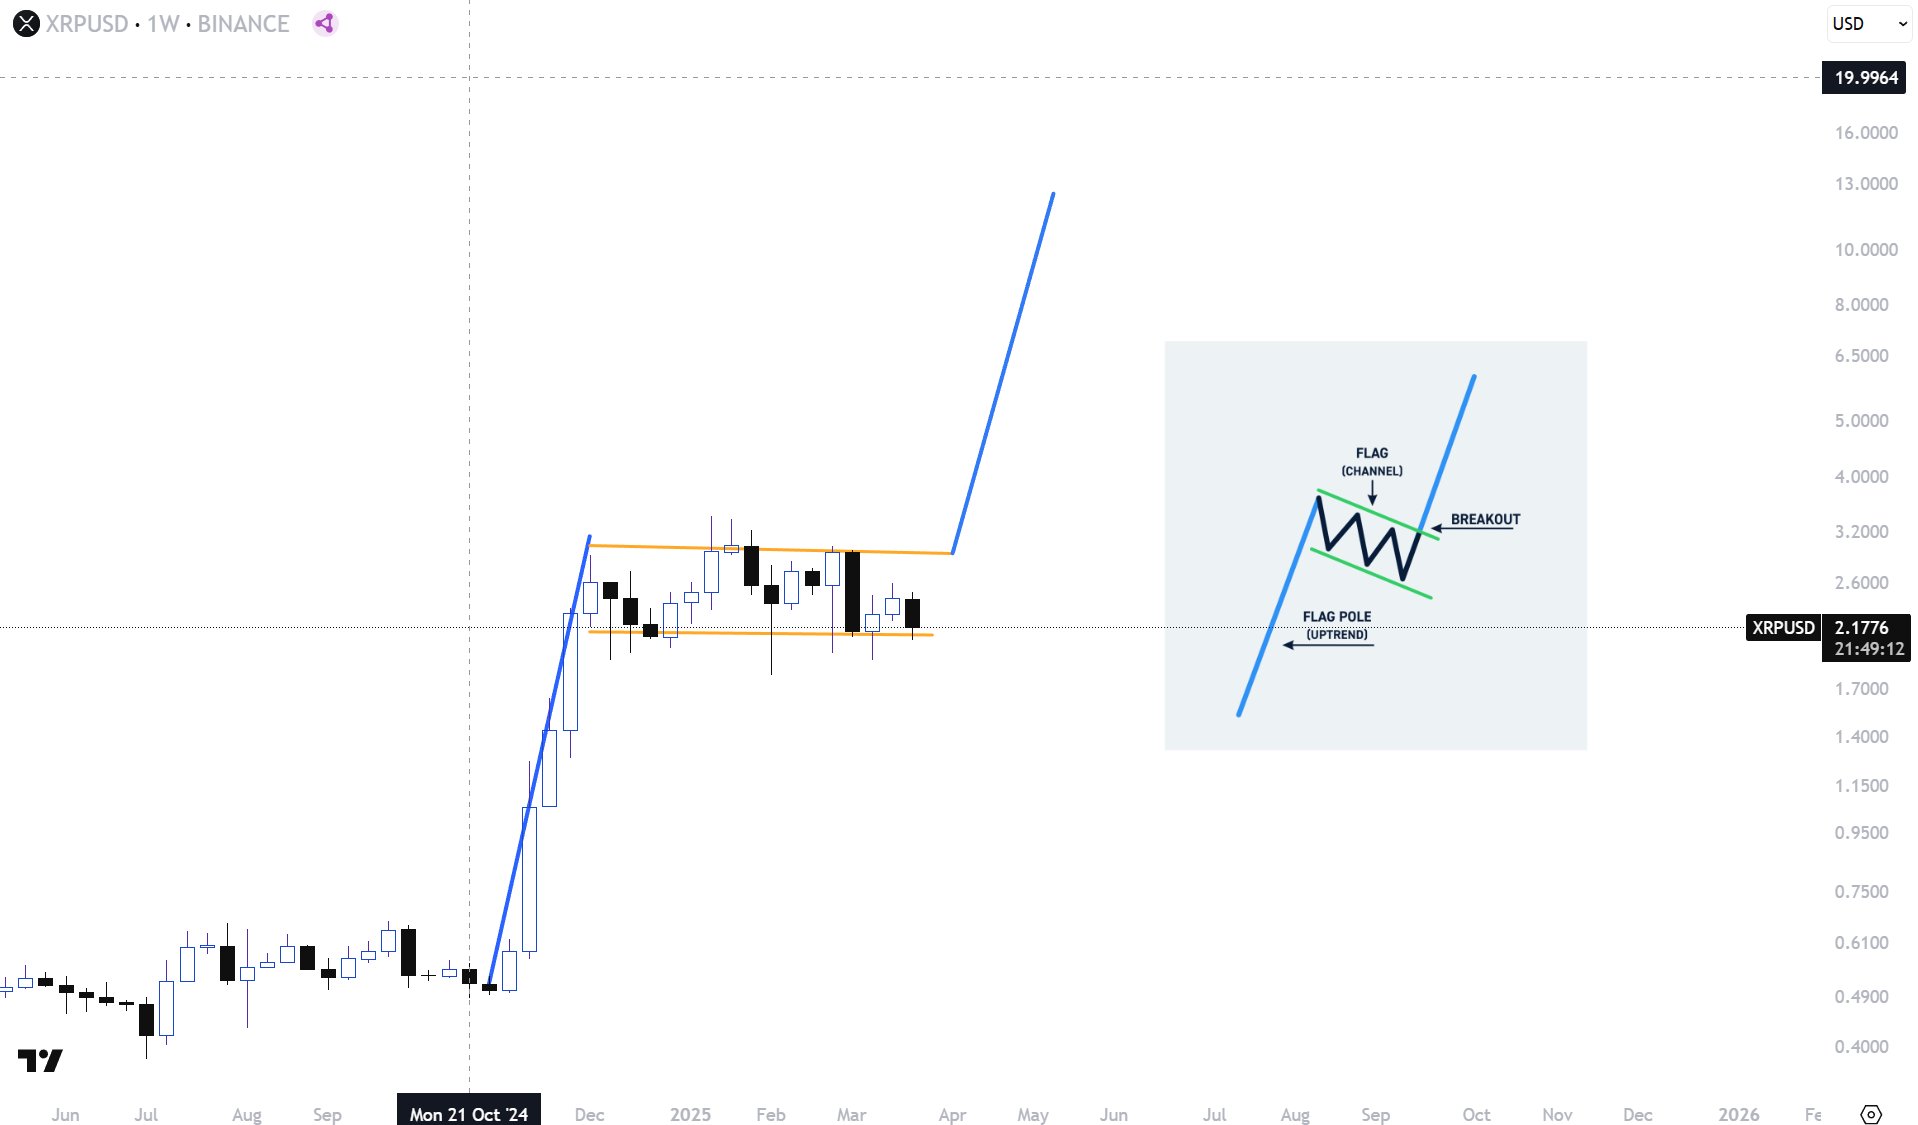
XRP/USD weekly price chart. Source: TradingView/Stellar Babe
A bull flag forms when the price consolidates inside a parallel channel after undergoing a strong uptrend. It resolves when the price breaks above the upper trendline and rises by as much as the previous uptrend’s height.
Related: XRP price may drop another 40% as Trump tariffs spook risk traders
Stellar Babe’s analysis notes that If XRP breaks above the flag’s upper boundary range at $3.21. Its projected target, based on the height of the flagpole, is around $12, up around 450% from current prices.
XRP’s five-year channel hints at rally to $6.50
XRP is currently consolidating within a long-term bullish structure, according to a recent analysis by InvestingScoope.
The chart shows XRP trading inside a five-year ascending channel, with the current move resembling the March 2020 to April 2021 rally based on price behavior and momentum indicators.
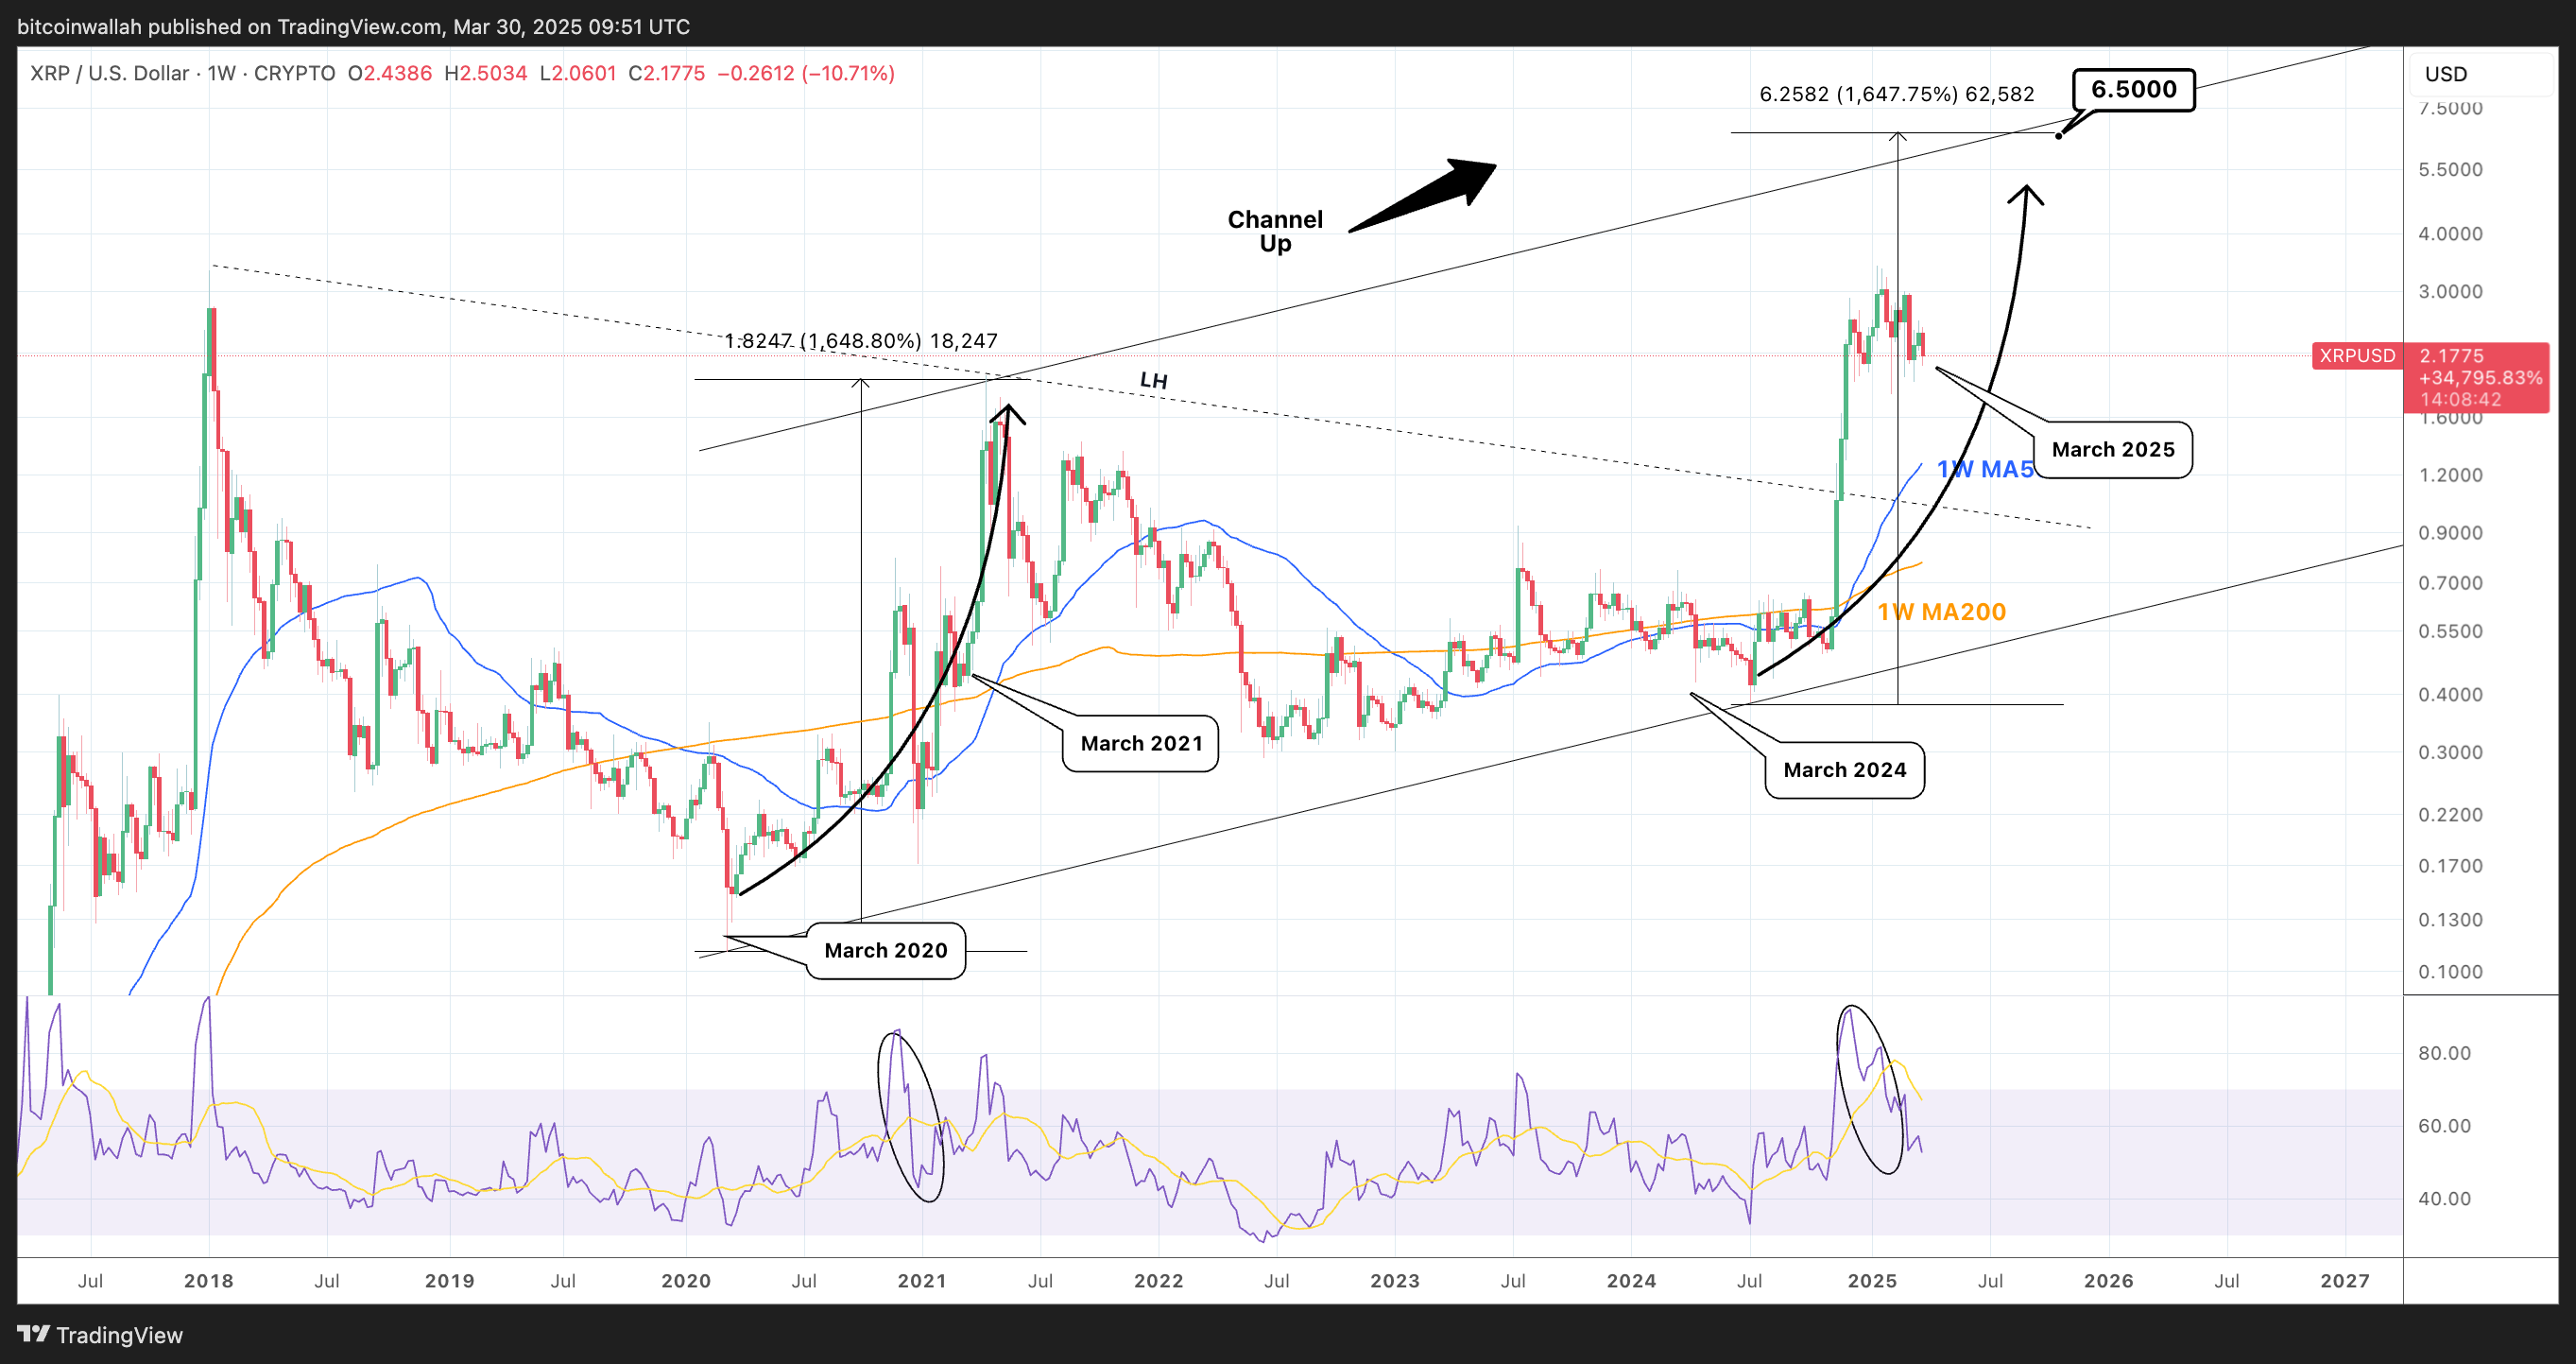
XRP/USD weekly price chart. Source: TradingView/InvestingScoope
Despite the pullback, the broader bullish cycle stays intact as long as XRP holds above the 50-week moving average (1W MA50).
InvestingScoope notes that this phase mirrors March 2021, which preceded a strong breakout. If the pattern continues, XRP price could be preparing for its next leg up with a potential target of $6.50 in the months ahead.
This article does not contain investment advice or recommendations. Every investment and trading move involves risk, and readers should conduct their own research when making a decision.


