

According to a recent post on X by crypto analyst Rekt Capital, Bitcoin (BTC) may finally be showing early signs of bullish divergence. If this pattern plays out, BTC could target the $101,000 level as its first milestone before moving higher.
Bitcoin Showing Signs Of Bullish Divergence? Analyst Weighs In
Since the beginning of February, the flagship cryptocurrency has endured multiple macroeconomic uncertainties, including US President Donald Trump’s proposed trade tariffs, the US Federal Reserve’s (Fed) hawkish statements, and the stock market downturn triggered by the release of China’s DeepSeek AI model.
Related Reading
Despite these challenges, BTC has remained range-bound between $93,000 and $98,000. However, early signs of a potential bullish divergence are beginning to emerge.
Rekt Capital pointed out BTC’s repeated failure to achieve a successful daily close above the $97,700 level, forcing it to find support around $93,000 at the lower end of its trading channel. While BTC continues to consolidate within this tight range, it is displaying a bullish divergence, as the cryptocurrency’s relative strength index (RSI) has formed a higher low on the daily chart.
In this context, bullish divergence occurs when the price continues making lower lows while the RSI reverses course and forms a higher low. This momentum shift often signals an impending trend reversal, potentially propelling BTC toward the crucial $100,000 level.
However, not all analysts are convinced that BTC is out of the woods just yet. Crypto analyst Merlijn The Trader shared his perspective on BTC’s price action, emphasizing how the top cryptocurrency recently touched the 100-day exponential moving average (EMA) at $93,500. They cautioned:
Historically, closing below this level often means a drop to the 200EMA—currently at $86k. But until the daily 100EMA breaks, there’s no need for panic. Stay sharp, the market is at a pivotal point!
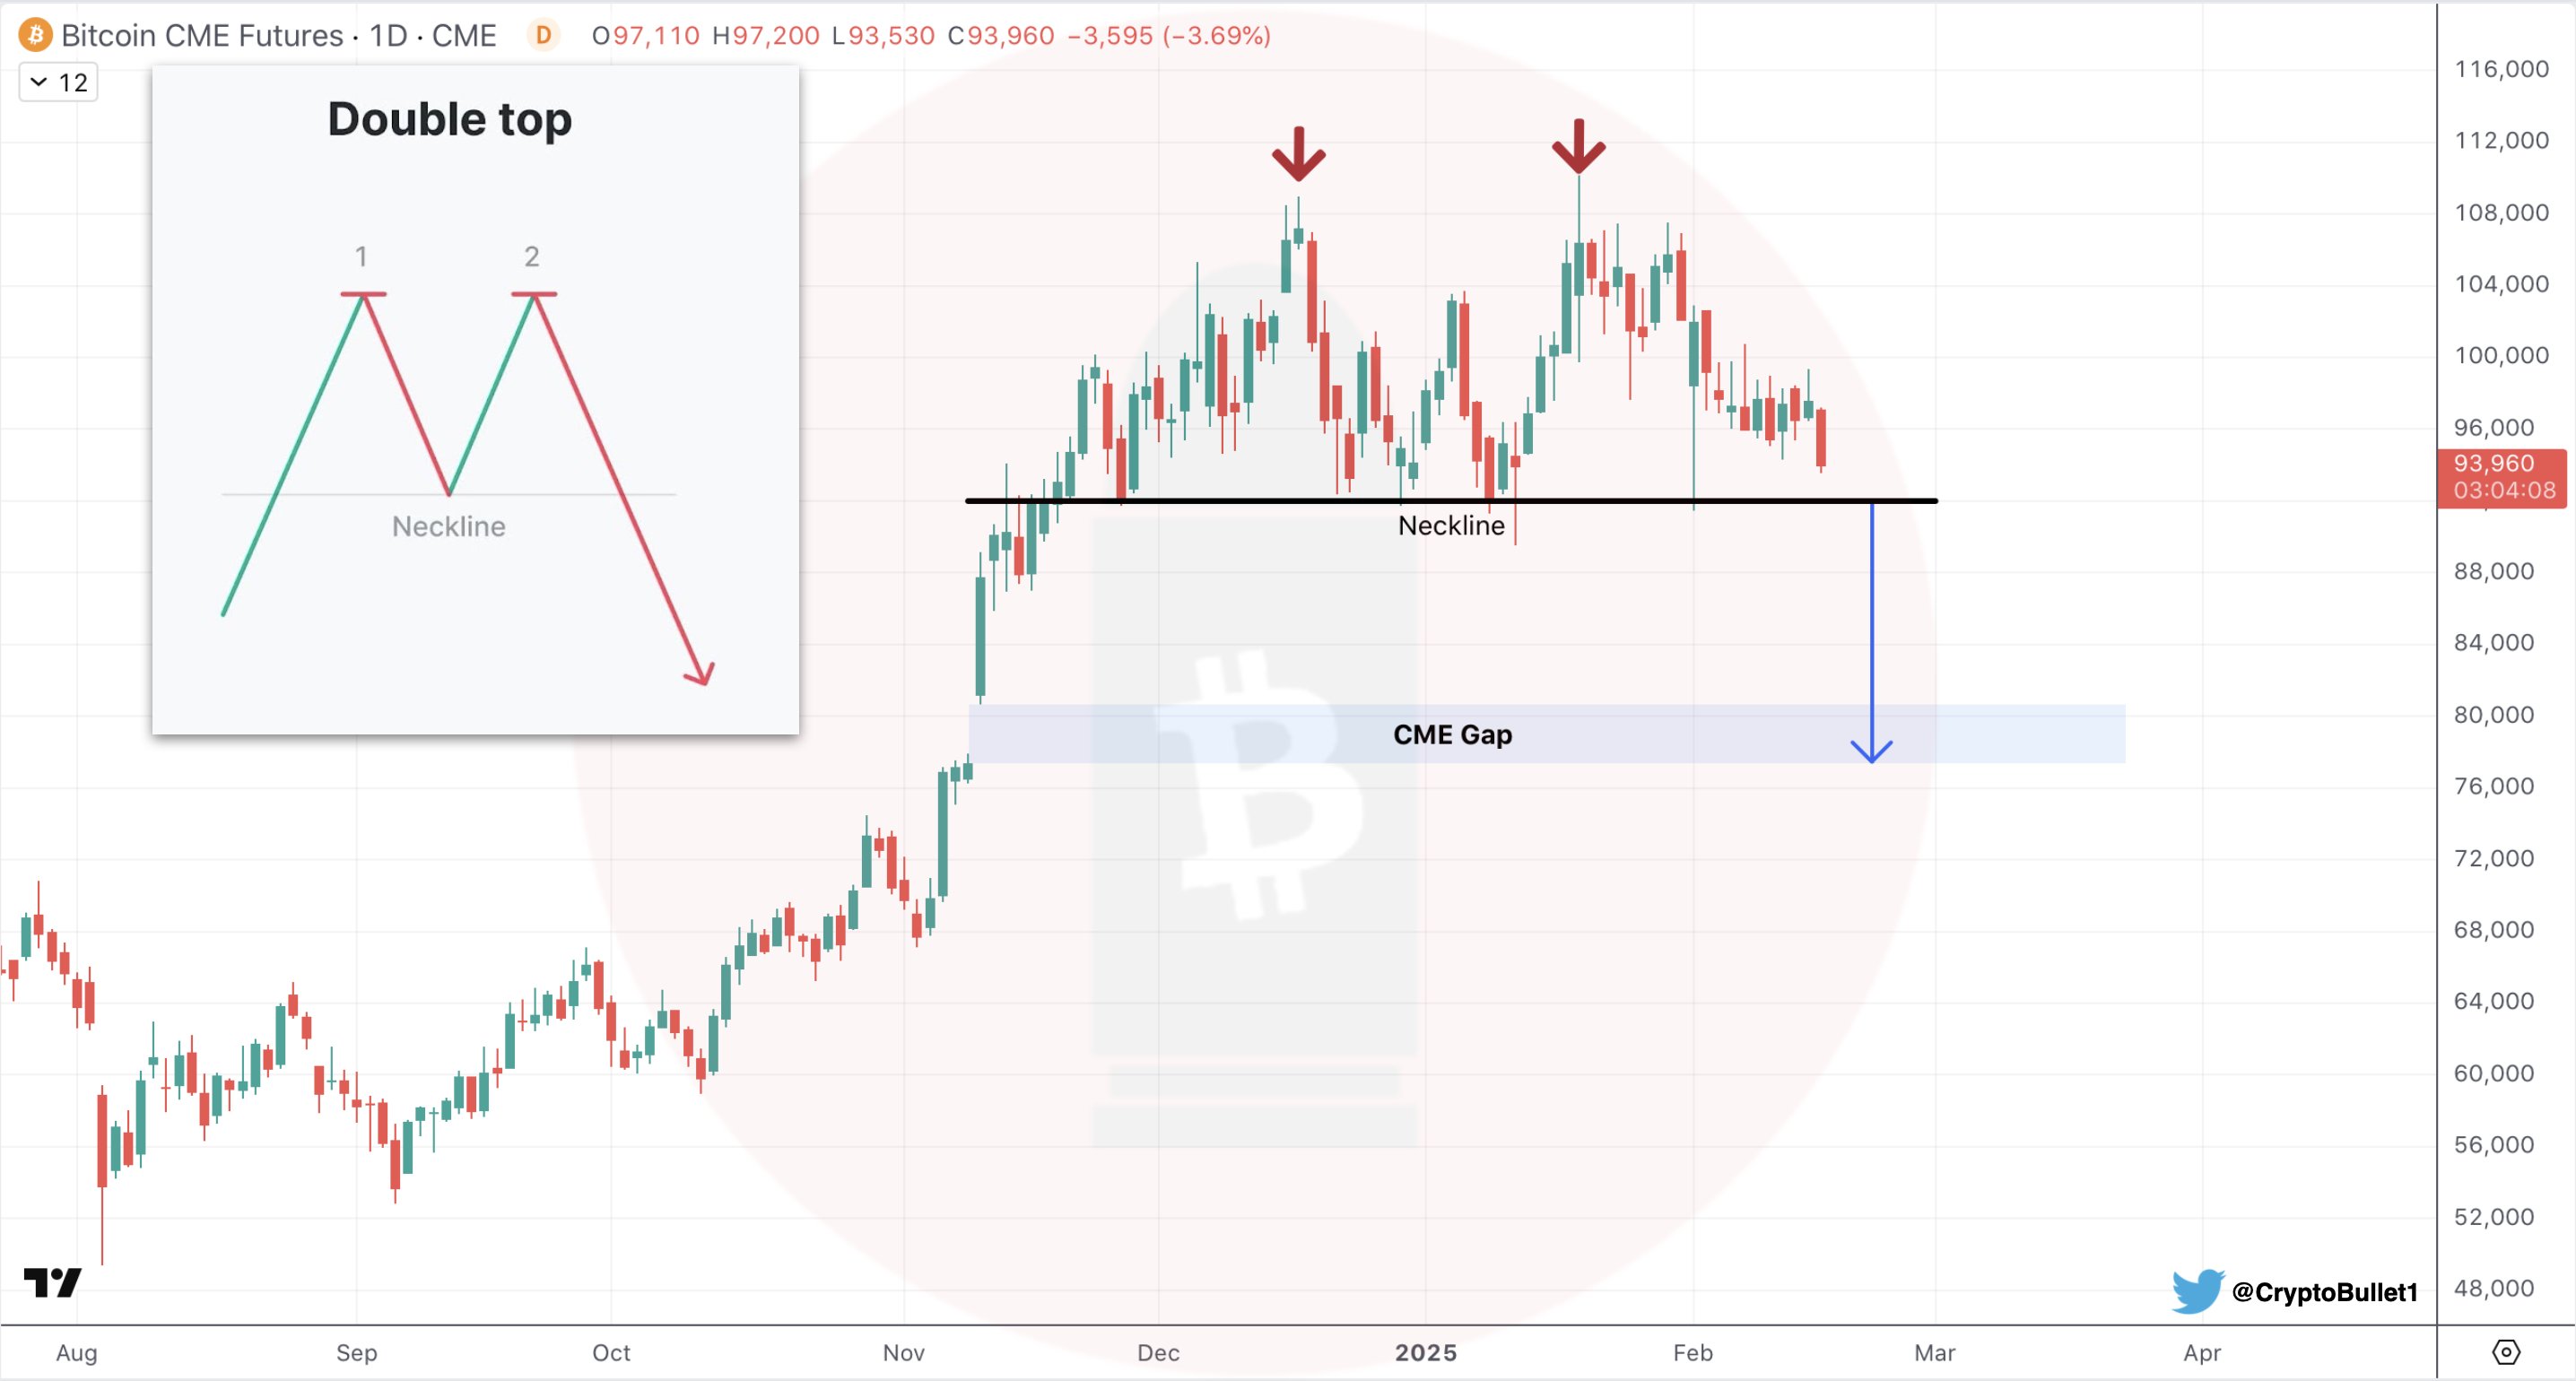
Will BTC Fill The CME Gap?
Meanwhile, crypto market analyst CryptoBullet pointed to a CME gap from November that BTC may need to fill before resuming its upward momentum. The analyst highlighted a double-top formation, which could lead BTC to retrace down to $76,000 to close the gap.
Related Reading
For those unfamiliar, the “CME gap” refers to a price difference on CME’s Bitcoin futures chart that arises when trading pauses for the weekend while BTC continues moving on other exchanges. These gaps often attract price action, as traders anticipate a revisit due to liquidity, technical factors, and market psychology.
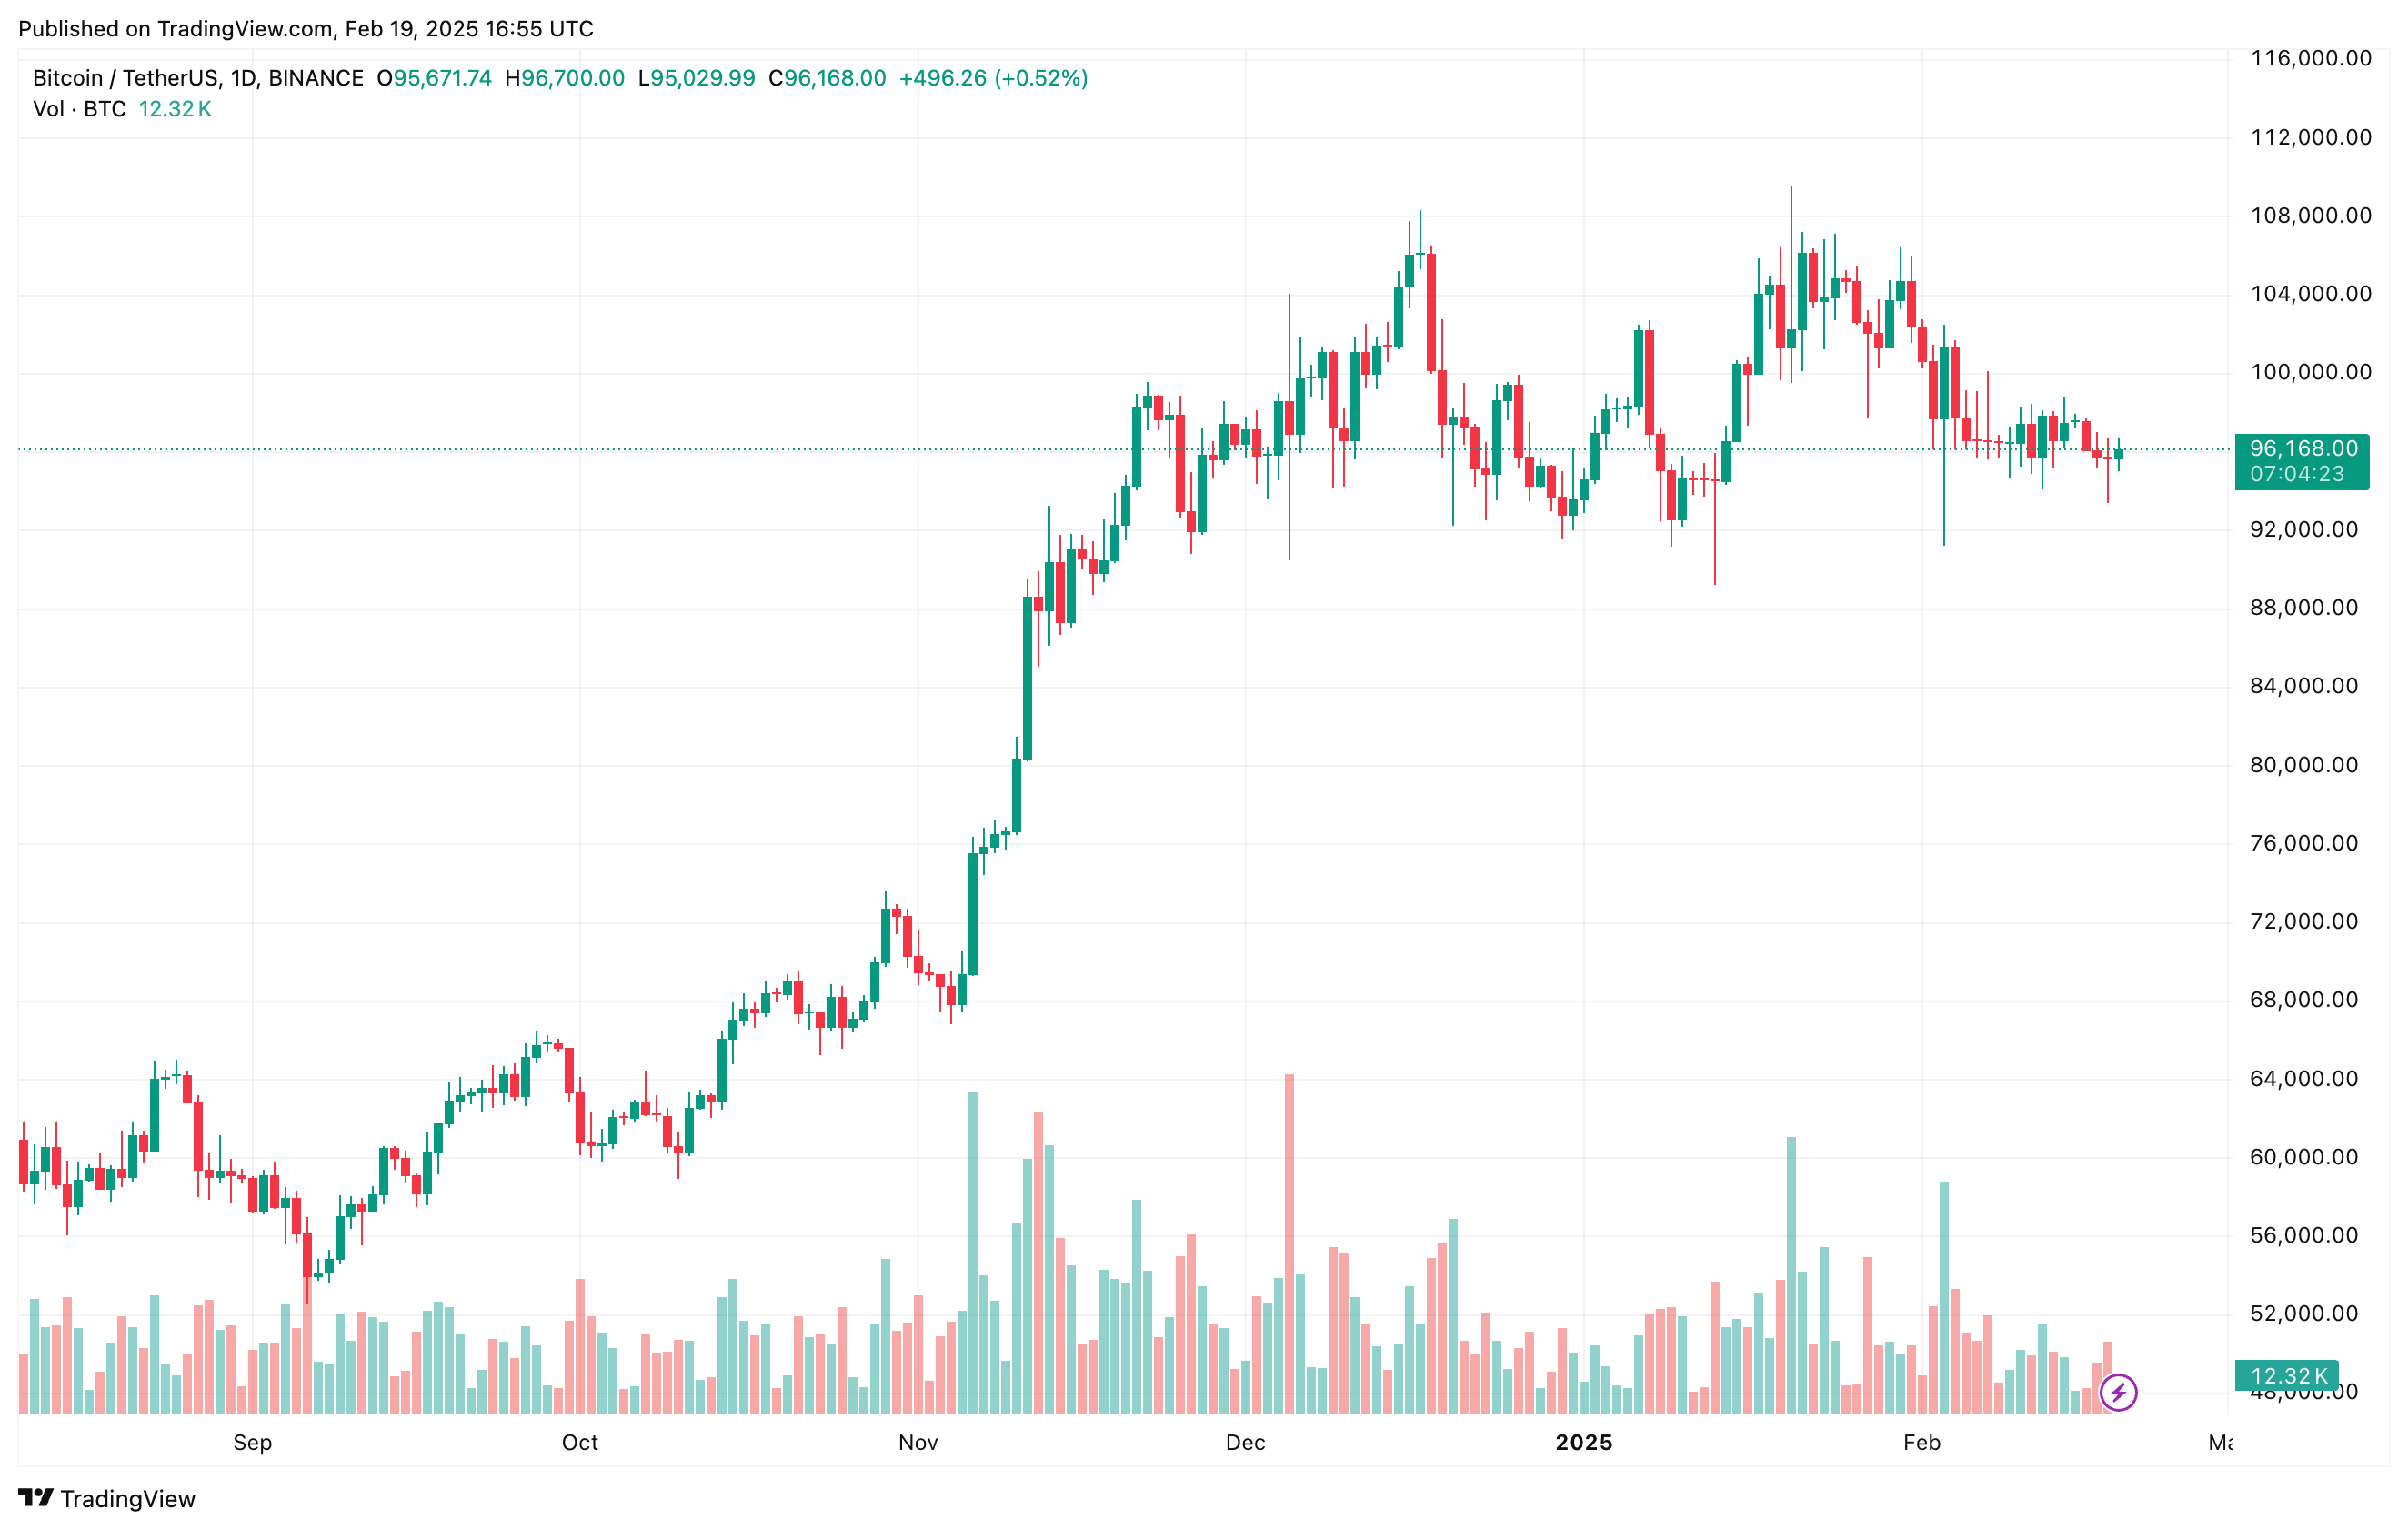
On a more optimistic note, Bitwise executives maintain that Bitcoin currently offers a “generational opportunity” despite the ongoing global macroeconomic turmoil. At press time, BTC trades at $96,168, up 1.3% in the past 24 hours.
Featured image from Unsplash, Charts from X and TradingView.com


