Crypto analyst Egrag recently delved into the XRP price charts and spotlighted signs that suggest a possible rally of more than 1,500% is on the horizon. The focus of this analysis is the ASO (Average Sentiment Oscillator), a metric that traders employ to determine market sentiment.
XRP Price Rally Of 1,500%+ Ahead?
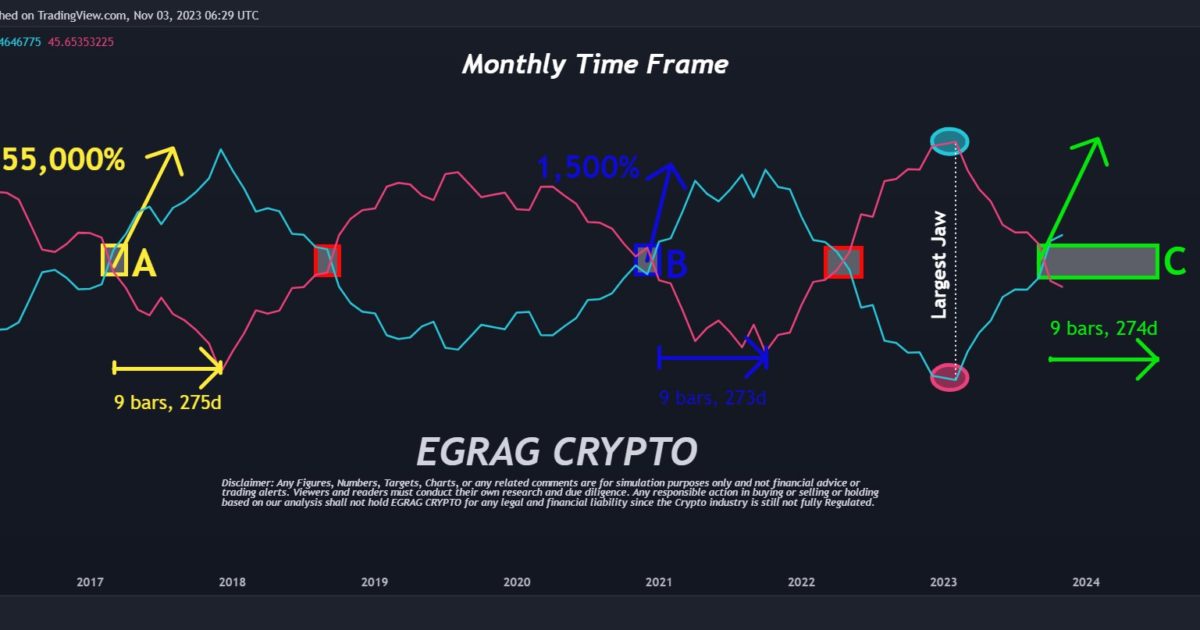
Egrag’s monthly XRP/USD chart showcases the convergence of the blue line, symbolizing bulls, and the red line, representing bears. A month ago, Egrag had marked a yellow box on his chart, predicting the bullish crossover to take place between the end of 2023 or the onset of the latter half of 2024.
Today, Egrag noted, “XRP ASO Update: The journey is only heading UP! I’ve been eagerly awaiting the bullish crossover of the ASO since February 2023. And guess what? It’s finally here!” Should XRP mimic its historical patterns, and if Egrag’s predictions hold true, the XRP price might witness some considerable price movements in the coming months.
Historically, the cryptocurrency experienced this bullish crossover twice before. The 2017 event led to a staggering 55,000% increase in XRP’s price, while the one from late 2020 to April 2021 resulted in a 1,500% appreciation. Given the “largest jaw” ever observed on the chart, Egrag has sparked discussions suggesting that the forthcoming rally could even outpace its predecessors.
By connecting the dots from the historical data and the recent crossover, Egrag further elaborated, “Looking at historical data, we can see that it typically takes around 275 days to reach the peak after this event.” If XRP follows its historical trends, as Egrag suggests, the XRP price might be gearing up for some substantial price action within the next 7-10 months.
Ending his tweet on a rallying note for the vast community of supporters, commonly referred to as the ‘XRP Army’, Egrag encouraged, STAY STEADY and keep on wearing your space suit.”
To provide more context, the ASO acts as a momentum oscillator, giving averaged percentages of bull/bear sentiment. It’s particularly potent in discerning sentiment during specific candle periods, assisting in trend identification or pinpointing entry/exit moments. The tool was conceived by Benjamin Joshua Nash and modified from its MT4 version. The oscillator’s design, showcasing Bulls % with a blue line and Bears % with a red line, illuminates the prevailing sentiment in the market.
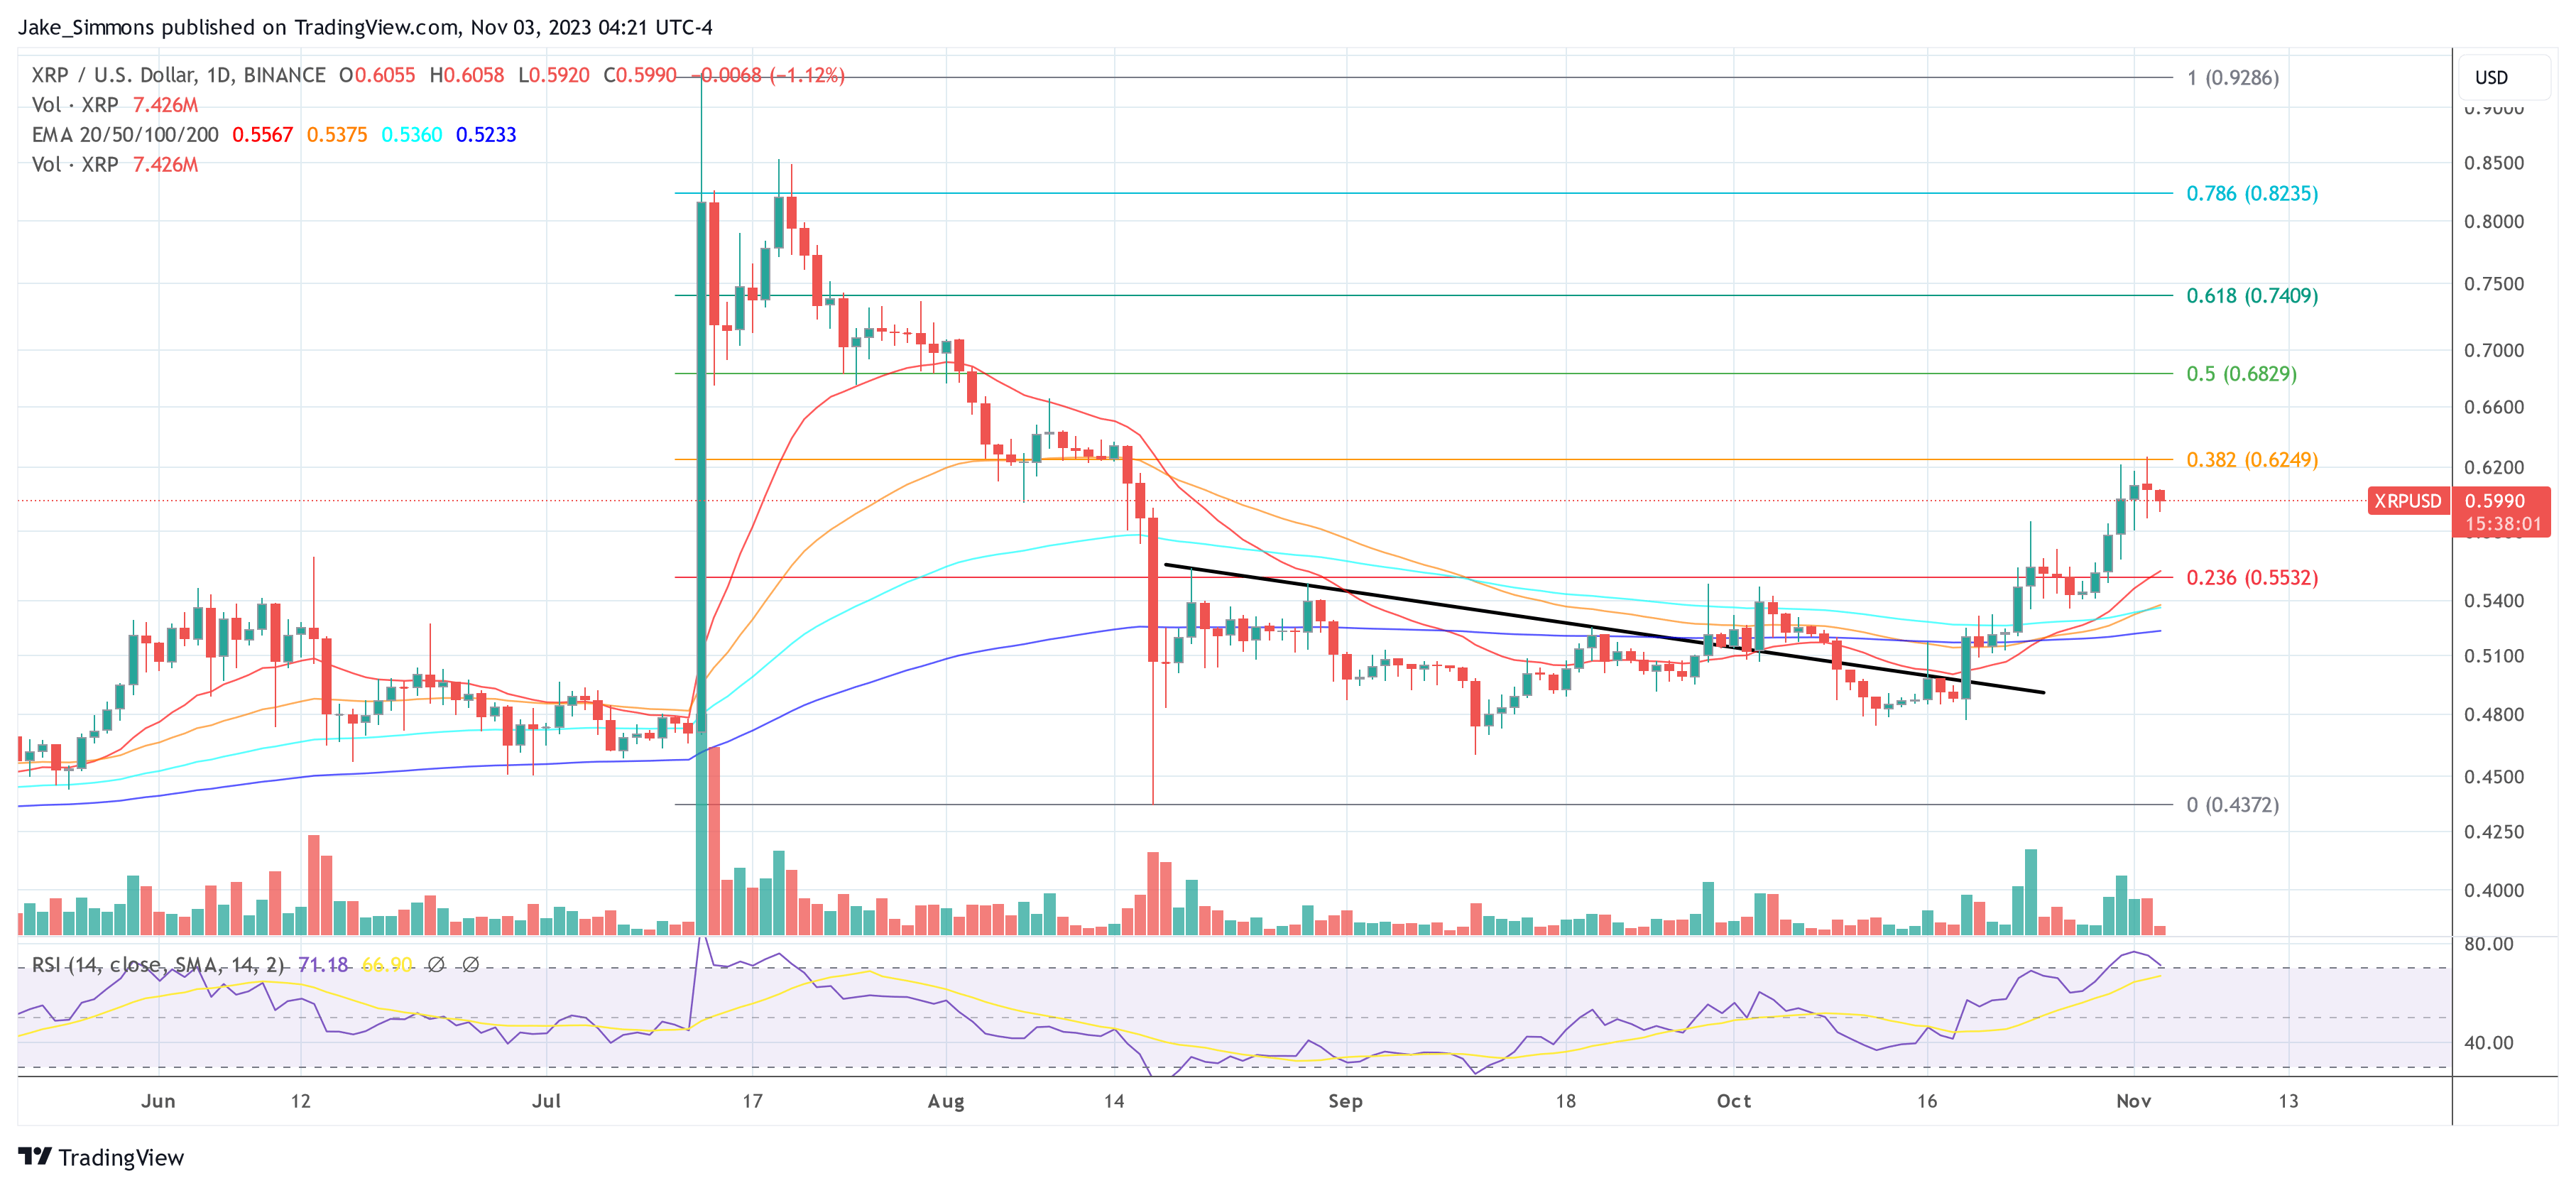
At press time, XRP traded at $0.5990. Upon examining the 1-day chart, it’s evident that the XRP price faced a second rejection at the 0.382 Fibonacci retracement level, which stands at $0.625.
Although the RSI has settled somewhat, it remains elevated in the overbought zone at 71. This suggests that the price might gear up for another shot at overcoming this resistance. However, if it doesn’t succeed, a pullback to the 0.236 Fibonacci retracement level, priced at $0.553, may be on the horizon. On the upside, the 0.5 Fibonacci retracement level, pegged at $0.683, represents the next potential price target.
Featured image from Shutterstock, chart from TradingView.com

