Market intelligence firm Messari recently released its third quarter (Q3) performance report for Polkadot (DOT), providing insights into the blockchain network’s development and financial metrics during this period.
Polkadot Sees Strong Developer Engagement
One of the notable findings from the report is the developer activity on Polkadot. According to Electric Capital, the network had approximately 2,400 monthly active developers in July 2024, with 760 classified as full-time contributors. This positioned Polkadot fourth among leading blockchain networks, trailing only Ethereum, Base, and Polygon.
Furthermore, Artemis tracked an average of 630 weekly active core developers and 760 ecosystem developers during Q3, underscoring a vibrant development community.
Related Reading
Polkadot also made significant strides in Q3 2024 with several key initiatives aimed at enhancing its ecosystem. The Decentralized Futures program, backed by a substantial $20 million fund and 5 million DOT tokens, has been pivotal in driving innovation.
This initiative provided grants to various projects focusing on marketing, business development, governance, and technology. Notable projects supported include AirLyft, DotPlay, and BlockDeep Labs.
Another critical development is the Cross-Consensus Message Format (XCM), a standardized messaging protocol that facilitates communication between different consensus-driven systems, including rollups.
Daily XCM transfers averaged around 1,000, representing a 34% decline quarter-over-quarter (QoQ). In contrast, non-asset transfer use cases, referred to as “XCM Other,” experienced a 5% increase, averaging 200 daily transfers.
Overall, total daily XCM messages averaged 1,300, reflecting a 29% drop QoQ. Despite these fluctuations, a significant portion of activity on the Polkadot network continues to occur through Polkadot rollups.
DOT Market Cap Plummets 27% In Q3
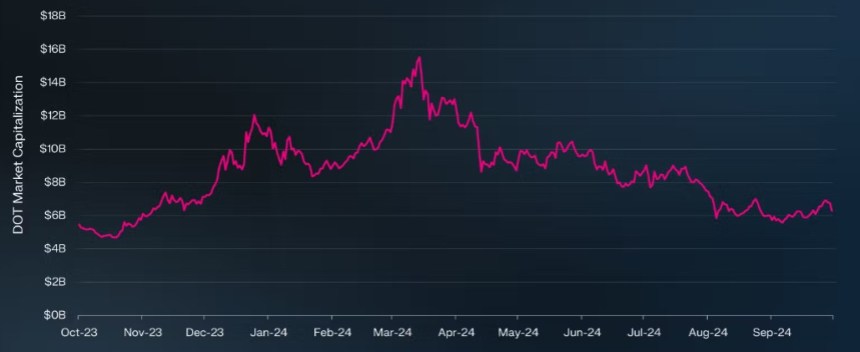
In terms of market performance, DOT has experienced notable volatility through the year. From Q3 2023 to Q1 2024, DOT’s market capitalization soared by 150%, rising from $5 billion to $13 billion.
However, in the subsequent quarters, including Q2 and Q3 2024, DOT retraced alongside the broader market, ending Q3 2024 with a market cap of $6.3 billion—a 27% decline QoQ. This drop also saw DOT’s market cap ranking fall from 14th to 15th, even as it remains the seventh largest base layer network.

Transaction fees on the Polkadot chain have generally remained lower compared to competitors, attributed to the network’s structural design. In Q3 2024, transaction fees aligned with historical averages, totaling $84,000—a 44% decrease QoQ. Fees denominated in DOT also declined by 21% to 17,000.
Related Reading
The Polkadot Treasury on the other hand, saw continued active usage, with 9.5 million DOT allocated for proposals, 7.4 million for bounties, and 2.5 million burned.
A significant development was the approval of Polkadot Referendum 457 in Q2 2024, which diversified the treasury with USDT and USDC, enabling treasury proposals to be denominated in stablecoins. By the end of Q3 2024, the treasury balance stood at $122 million.
Daily active addresses dropped to 6,200 (-26% QoQ), daily returning addresses decreased to 5,300 (-23% QoQ), and daily new addresses fell to 900 (-38% QoQ).
In terms of immediate price action, the DOT price has traded at the $8 level for the past four days, and has since consolidated above it. The token has been one of the best performers since Donald Trump’s election on November 5, posting a substantial 96% gain in the monthly time frame.
Featured image from DALL-E, chart from TradingView.com


