

Reason to trust
Strict editorial policy that focuses on accuracy, relevance, and impartiality
Created by industry experts and meticulously reviewed
The highest standards in reporting and publishing
Strict editorial policy that focuses on accuracy, relevance, and impartiality
Morbi pretium leo et nisl aliquam mollis. Quisque arcu lorem, ultricies quis pellentesque nec, ullamcorper eu odio.
Ethereum’s price action in the past 24 hours has been characterized by a fall toward $2,100 before rebounding to the upside very quickly. Ethereum’s price dropped to $2,130 in the past 24 hours on crypto exchange Coinbase amidst a broader fall in the crypto industry, which also saw Bitcoin break below $100,000 very briefly.
Despite the sudden Ethereum price correction, analysts have presented arguments that hint at a strong Ethereum rally once this current downturn is complete. Notably, their projections are not short-term, and one of them puts Ethereum’s next major target around $6,000.
Wave A Complete, But Downside Likely Before Rally
The first detailed analysis came from @CryptoWaveV, a trader who uses Elliott Wave Theory to forecast market structure. According to his recent post, Ethereum’s price has now completed what he considers to be wave A of a larger corrective structure. His chart shows Ethereum breaking down from a high around $2,900 and falling almost directly into a Fibonacci-based support zone between $2,134 and $1,957.
Related Reading
Now that the Wave A pattern is complete, the prediction is a short-term bounce to as high as $2,792 as part of a wave B retracement. However, this upward move would likely be temporary before another Wave C leg downward, which could drive the Ethereum price to as low as $1,706 before a meaningful bottom is confirmed.
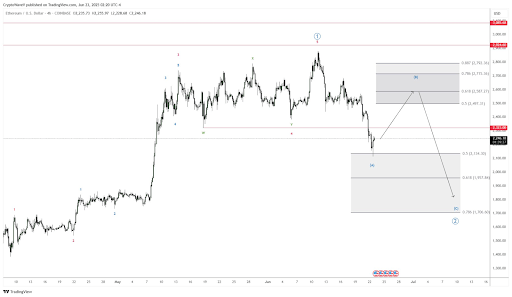
This level is what the analyst refers to as his “ideal buy zone” for long-term accumulation. Although the short-term view includes price crashes, a full bullish impulse will resume once this corrective phase is complete.
Wyckoff Structure Points $6,000 ETH Price
Merlijn, a popular analyst on X, shared a contrasting yet converging perspective. In this case, the analyst’s outlook is based on Wyckoff’s accumulation framework. Merlijn stated, “Ethereum: Wyckoff says go.”
Related Reading
According to the daily price chart that followed his analysis, the analyst showed that the crypto had already completed the spring and test phases, which are both components of a Wyckoff accumulation pattern. What comes next, according to the Wyckoff method, is the markup phase.
The chart Merlijn posted aligns with this outlook. The chart projected that Ethereum will reclaim a horizontal range between $2,150 and $2,450, followed by a steady progression above $3,850, and then another strong move past $4,800, before ultimately culminating around $6,800 to $7,000. This bullish setup suggests that while the recent dip to $2,100 might have shaken confidence, it may have served a larger structural purpose. The spring and test patterns imply a final shakeout of weak hands, clearing the path for long-term buyers to step in.
Finally, the outlooks from both analysts converge on a six-month to one-year trajectory that could see Ethereum breaking into the $6,000 range, if not higher. At the time of writing, Ethereum is trading at $2,420, up by 7.4% in the past 24 hours.

Featured image from Getty Images, chart from Tradingview.com


