

Reason to trust
Strict editorial policy that focuses on accuracy, relevance, and impartiality
Created by industry experts and meticulously reviewed
The highest standards in reporting and publishing
Strict editorial policy that focuses on accuracy, relevance, and impartiality
Morbi pretium leo et nisl aliquam mollis. Quisque arcu lorem, ultricies quis pellentesque nec, ullamcorper eu odio.
Ethereum’s price action this week has been very notable, with the leading altcoin breaking above $2,800 again for the first time in four months. Ethereum managed to break above the $2,800 mark for the first time since February, briefly touching $2,870 before pulling back slightly.
Related Reading
Two separate analyses by crypto strategist Crypto Patel on the social media platform X suggests Ethereum is now on the right track. The first, based on an 8-hour chart, highlights a rally toward $4,000. The second, using a long-term two-week timeframe, outlines a bullish setup that could send Ethereum soaring to $10,000 and beyond.
Ethereum’s Breakout From Sideways Consolidation Zone
In a recent analysis shared on X, a crypto analyst known as Crypto Patel highlighted Ethereum’s attempt to break out of its established range. Using the 8-hour candlestick chart, he pointed out how the Ethereum had spent many weeks since early May trading between clear support at $2,366 and resistance around $2,734. The breakout seen on the chart occurred just above this resistance zone, when Ethereum briefly pushed past $2,800 before facing some rejection.
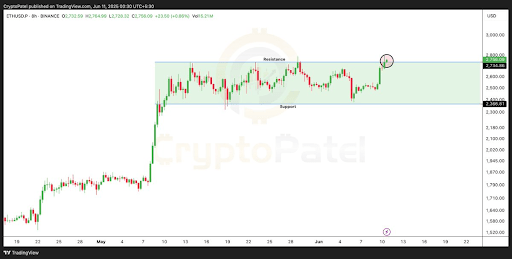
If this breakout holds above $2,800, Ethereum could initiate a steep upward rally toward the $3,500 to $4,000 region in the coming weeks. Crypto Patel noted the importance of watching whether Ethereum sustains above the $2,750 breakout line, as a successful confirmation could trigger an influx of bullish momentum.
Ethereum’s To $10,000 In The Long-Term
In a follow-up post analyzing a much larger timeframe, Crypto Patel shared a two-week candlestick chart that mapped Ethereum’s longer-term structure since 2018. The chart revealed a well-defined bullish setup, including a bounce from a key bullish order block around $1,400 in April. This bounce acted as a support level, with the resulting candlestick being a bullish one that broke through another order block between $1,700 and $2,500.
Related Reading
Patel pointed out that Ethereum is now showing signs of a long-term bullish continuation pattern. With support levels already locked in for the next bear market, the analyst projected a target above $10,000, citing a 438% upside potential from current price levels. The chart also marks $2,500 as a structural pivot point, with Ethereum’s ongoing upward trajectory expected to strengthen if this support level continues to hold.
Therefore, the path to $10,000 will depend on Ethereum’s ability to turn its recent resistance break into sustained momentum. The $2,800 region must now serve as a support base rather than a resistance ceiling. However, this has failed to really materialize in the past 24 hours, as Ethereum is currently down by a massive 9.6%.
The ensuing price action has seen the leading altcoin now back trading within this consolidation range. Failure to hold above $2,500 could cascade to more losses over the weekend until it closes on $2,366 again and probably initiate another bounce from here.

Featured image from Getty Images, chart from Tradingview.com


