

Reason to trust
Strict editorial policy that focuses on accuracy, relevance, and impartiality
Created by industry experts and meticulously reviewed
The highest standards in reporting and publishing
Strict editorial policy that focuses on accuracy, relevance, and impartiality
Morbi pretium leo et nisl aliquam mollis. Quisque arcu lorem, ultricies quis pellentesque nec, ullamcorper eu odio.
Ethereum (ETH) is retesting a crucial resistance level amid its daily 3% recovery. The cryptocurrency has been rejected from this area since last month’s market recovery, failing to continue its bullish rally. As its price continues its sideways trajectory, an analyst suggests that a 15% move is coming.
Related Reading
Ethereum Price Compressing Within Key Levels
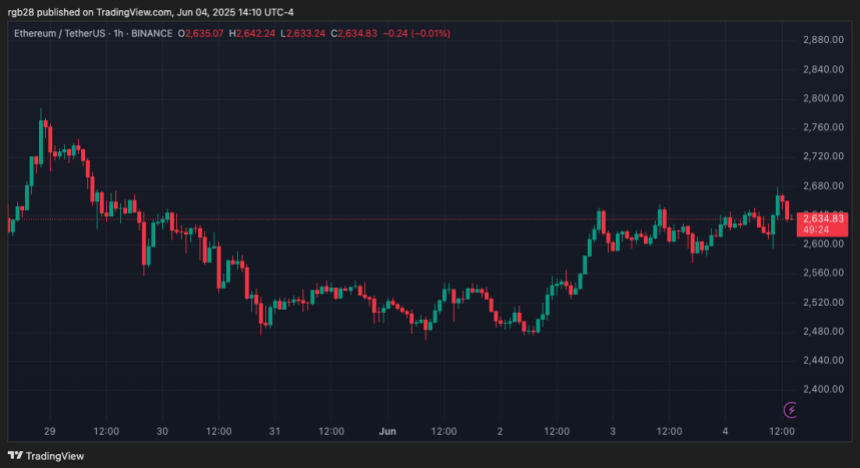
Since its early May breakout, Ethereum has been trading between the $2,475-$2,680 price range, failing to turn the range’s upper boundary as support for nearly a month. Amid last week’s market pullback, the cryptocurrency retraced around 11% from its three-month high of $2,788 to the range’s lower boundary, bouncing from this area on Monday.
At the start of the week, ETH reclaimed the $2,500 mark and continued its recovery rally toward the $2,600 resistance. On Wednesday, the King of Altcoins saw a 3.2% daily surge toward the local range high resistance before retracing to the $2,635 level.
Carl Runefelt from The Moon Show highlighted the cryptocurrency’s recent performance, affirming that Ethereum is “showing confidence” by staying inside a key formation in the daily timeframe.
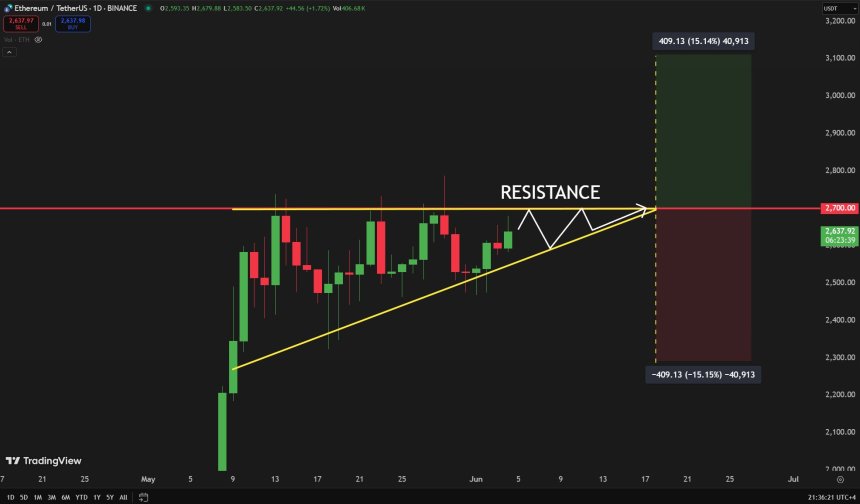
According to the chart, Ethereum has been forming an ascending triangle since the May rally, with the upper line around the $2,680-$2,700 mark. Moreover, ETH’s price has been compressing between the support and resistance lines, suggesting a potential 15% move if the price breaks out of the pattern.
Runefelt forecasted a surge toward the $3,100 level if the Altcoin reclaims the crucial resistance level. However, if the price is rejected once again from this level, the analyst considers that Ethereum could drop to the $2,300 support zone.
Crypto Bullet pointed out a similar pattern on multiple ETH charts, suggesting that a 15%-20% breakout is imminent for the cryptocurrency. Per the post, the ETH Dominance is “about to break out” from an ascending triangle pattern in the 12H chart, while the ETH/BTC and ETH/USD trading pairs are nearing the upper boundary of a one-month symmetrical pattern.
ETH Preparing For Liftoff?
Analyst Crypto Jelle asserted that once ETH reclaims the major resistance area, between $2,680-$2,850, “everything flies higher.” Notably, a reclaim of this zone would send the cryptocurrency above its multi-year ascending support trendline, which was along amid the Q1 2025 retraces, and set the stage for a surge toward the cycle highs.
Meanwhile, Ted Pillows noted that ETH’s performance this cycle resembles Bitcoin’s (BTC) price action in 2020. According to the analyst, Ethereum has formed four consecutive 2-week candles since the April 7 bottom, which mimics BTC’s movement after the March 2020 crash.
“The similarities between BTC 2020 and ETH 2025 are just mind-blowing,” he stated, suggesting that Ethereum could reach a new all-time high (ATH) in the coming months if it continues to follow BTC’s 2020-2021 trajectory.
Related Reading
Market watcher Merlijn The Trader highlighted the same similarities between the flagship cryptocurrency and Ethereum, adding that the King of Altcoins also “just nailed the Spring & Test phase of Wyckoff.”
According to the trader, ETH’s structure “screams one thing: Jump. Across. The. Creek. The breakout is coming.”
As of this writing, Ethereum trades at $2,632, a 44.2% increase in the monthly timeframe.
Featured Image from Unsplash.com, Chart from TradingView.com


