Ethereum Classic (ETC) produced a godlike candle as the market’s sentiments changed to bullish against tether (USDT). The crypto market has become promising as most altcoins appear bullish, coming out of their shells with the like of Ethereum Classic producing double gains ahead of the “Ethereum Merge” sentiment pulling altcoins higher. (Data from Binance)
Ethereum Classic (ETC) Price Analysis On The Weekly Chart
The price of ETC has had a tough time in recent weeks, with the price falling to a weekly low of $14; the price of ETC bounced off from this region as price rallied to a high of $30 after forming a bearish downtrend channel.
ETC price was able to break out of the downtrend channel, forming a strong bullish bias as the crypto market could be set for a minor rally.
The price of ETC saw it rejected from $30, but the price was able to break above this price and retested the channel, thereby flipping the downtrend resistance into support. This has seen the price of ETC remain bullish above $30 as prices continue to rally to $40.
If the ETC price maintains this structure, we could see the price of ETC rejecting another high acting as resistance in the region of $50-57, but if bears push the price of ETC, we could see a retest of $30 acting as a good support area.
Weekly resistance for the price of ETC – $50-$57.
Weekly support for the price of ETC – $30.
Price Analysis Of ETC On The Daily (1D) Chart

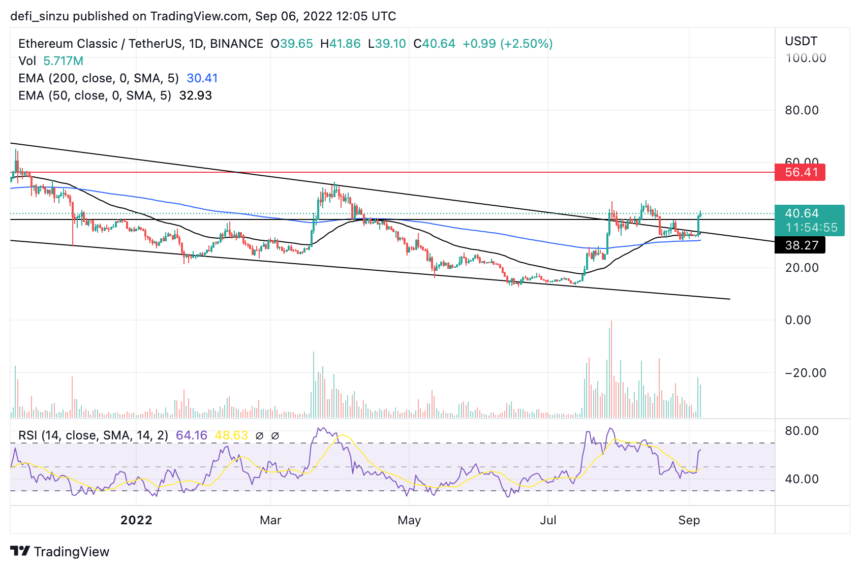
After breaking out of the downtrend channel and retesting, the price of ETC looks bullish and will continue to trend higher to a region of $56, where it will face resistance. The current state of ETC shows its bullish structures with good buy volume accompanying it.
With buy orders accompanying the price of ETC, we could see the resistance at $56 being flipped into support; if the price of ETC fails to trend higher above $56, the support area at $38 will hold the price sell-off.
The price of ETC is trading at $40 above its 50 and 200 Exponential Moving Averages (EMA) on the daily timeframe. The prices at $32 and $30, which correspond to the 50 and 200 EMA, act as support for the ETC price.
Daily (1D) resistance for the ETC price – $56.
Daily (1D) support for the ETC price – $32-$30.
ETC Price Analysis On The One Four-Hourly (4H) Chart
The price of ETC in the 4H timeframe continues to look bullish as the price shows bullish continuation pattern trading slightly above the 50 and 200 EMA acting as support.
ETC price continues to look more bullish after breaking out of the symmetric triangle confirming a more bullish bias.
The price of ETC holds above the 50 and 200 EMA and could trend higher if it breaks the resistance at $50; if the price of ETC gets rejected, the support at $38 will hold the price of ETC.
On the 4H Chart, ETC’s Relative Strength Index (RSI) is above 70, indicating buy order volume for the ETH price.
Four-Hourly (1H) resistance for the ETC price – $50.
Four-Hourly (1H) support for the ETC price – $38.
Featured Image From Wikipedia, Charts From


