Renowned crypto analyst Egrag presented a compelling Elliott Wave analysis on the potential XRP price trajectory in a tweet today. Drawing attention to the inner workings of the Elliott Wave theory, he highlighted that XRP has entered Wave 3 in recent days, which in particular plays a transformative role in determining the course of asset prices.
In Egrag’s words: “XRP aiming to $27 – Wave 1 inside Wave 3: Diving into the Elliott Wave theory as we explore the potential for XRP to reach $27! Wave 3 is typically a game-changer in the Elliott Wave theory.”
Elliott Wave Analysis: Wave 3
The crypto analyst further elaborated that Wave 3 emerges as the trend’s dominant force, outshining other waves in size and influence. This stage often witnesses positive news that prompts fundamental analysts to revise their outlook, giving a boost to upward momentum.
Notably, prices tend to shoot up rapidly during this phase, with minimal corrections. Investors who try to enter the market on a pullback often find themselves missing out as the third wave gains traction. At the outset, pessimistic news might still dominate, with most market participants maintaining a bearish stance. However, as Wave 3 unfolds, a significant shift towards bullish sentiment becomes evident among the majority.
Deep-diving into the XRP analysis, Egrag points out that the green wave count reflects the Grand Cycle spanning from 2014 to 2018. This cycle commenced with Wave 1 and was succeeded by a corrective Wave 2. “Presently, XRP finds itself amidst the thrilling currents of Wave 1 within the Grand Cycle’s Wave 3. Prepare for a fascinating journey ahead!” he noted.
He further elucidated that XRP has adeptly navigated through the initial waves and is now setting its course for the anticipated Wave 3, which he predicts will touch the Fibonacci 1.618 mark at $6.5, followed by a brief correction. The subsequent and concluding phase, Wave 5, according to Egrag’s analysis, will propel the XRP price to a staggering $27.
A Deep-Dive Into Egrag’s XRP Price Chart
Egrag’s analysis delineates the intricate voyage of the XRP price through the conceptual lenses of the Elliott Wave theory. The chart starts its narrative in March 2020, when the subordinate Wave 1 began. This initial phase witnessed XRP escalating to a prominent peak of $1.96, buoyed by a favorable outcome in Ripple’s legal battle with the US Securities and Exchange Commission (SEC).
Subsequent to the apex of Wave 1, the chart navigates through a territory marked by correction, which is dubbed Wave 2. In this segment, the XRP price experienced a pullback and dropped to a low of $0.4313. This corrective phase, although incisive, respects the sanctity of Elliott wave norms by not falling below the initial point of Wave 1.
With the transition into the Wave 3 area, bullish momentum is currently starting to build up. Egrag, with a combination of analysis and foresight, expects the XRP price to rise beyond the zenith of Wave 1 and target the Fibonacci extension of 1.618, valued at around $6.57. This upside, plotted on Egrag’s chart, is expected to end sometime in 2024 or 2025.
Wave 4, as described by Egrag, provides for a corrective move following the upswing of Wave 3. At this point, the XRP price is expected to drop heavily and find support at $1.96, which interestingly mirrors the peak of Wave 1.
In Egrag’s chart, Wave 5 emerges as the pinnacle of the bull market. In this decisive phase, the analyst projects his most audacious forecast for the XRP price trajectory. Anticipating a monumental bull surge in 2025, he envisions XRP oscillating between Fibonacci extension levels of 2.272 and 2.414, corresponding to price points of $23.63 and $31.20. Egrag, averaging the values, subsequently forecasts a price target of $27 for XRP.
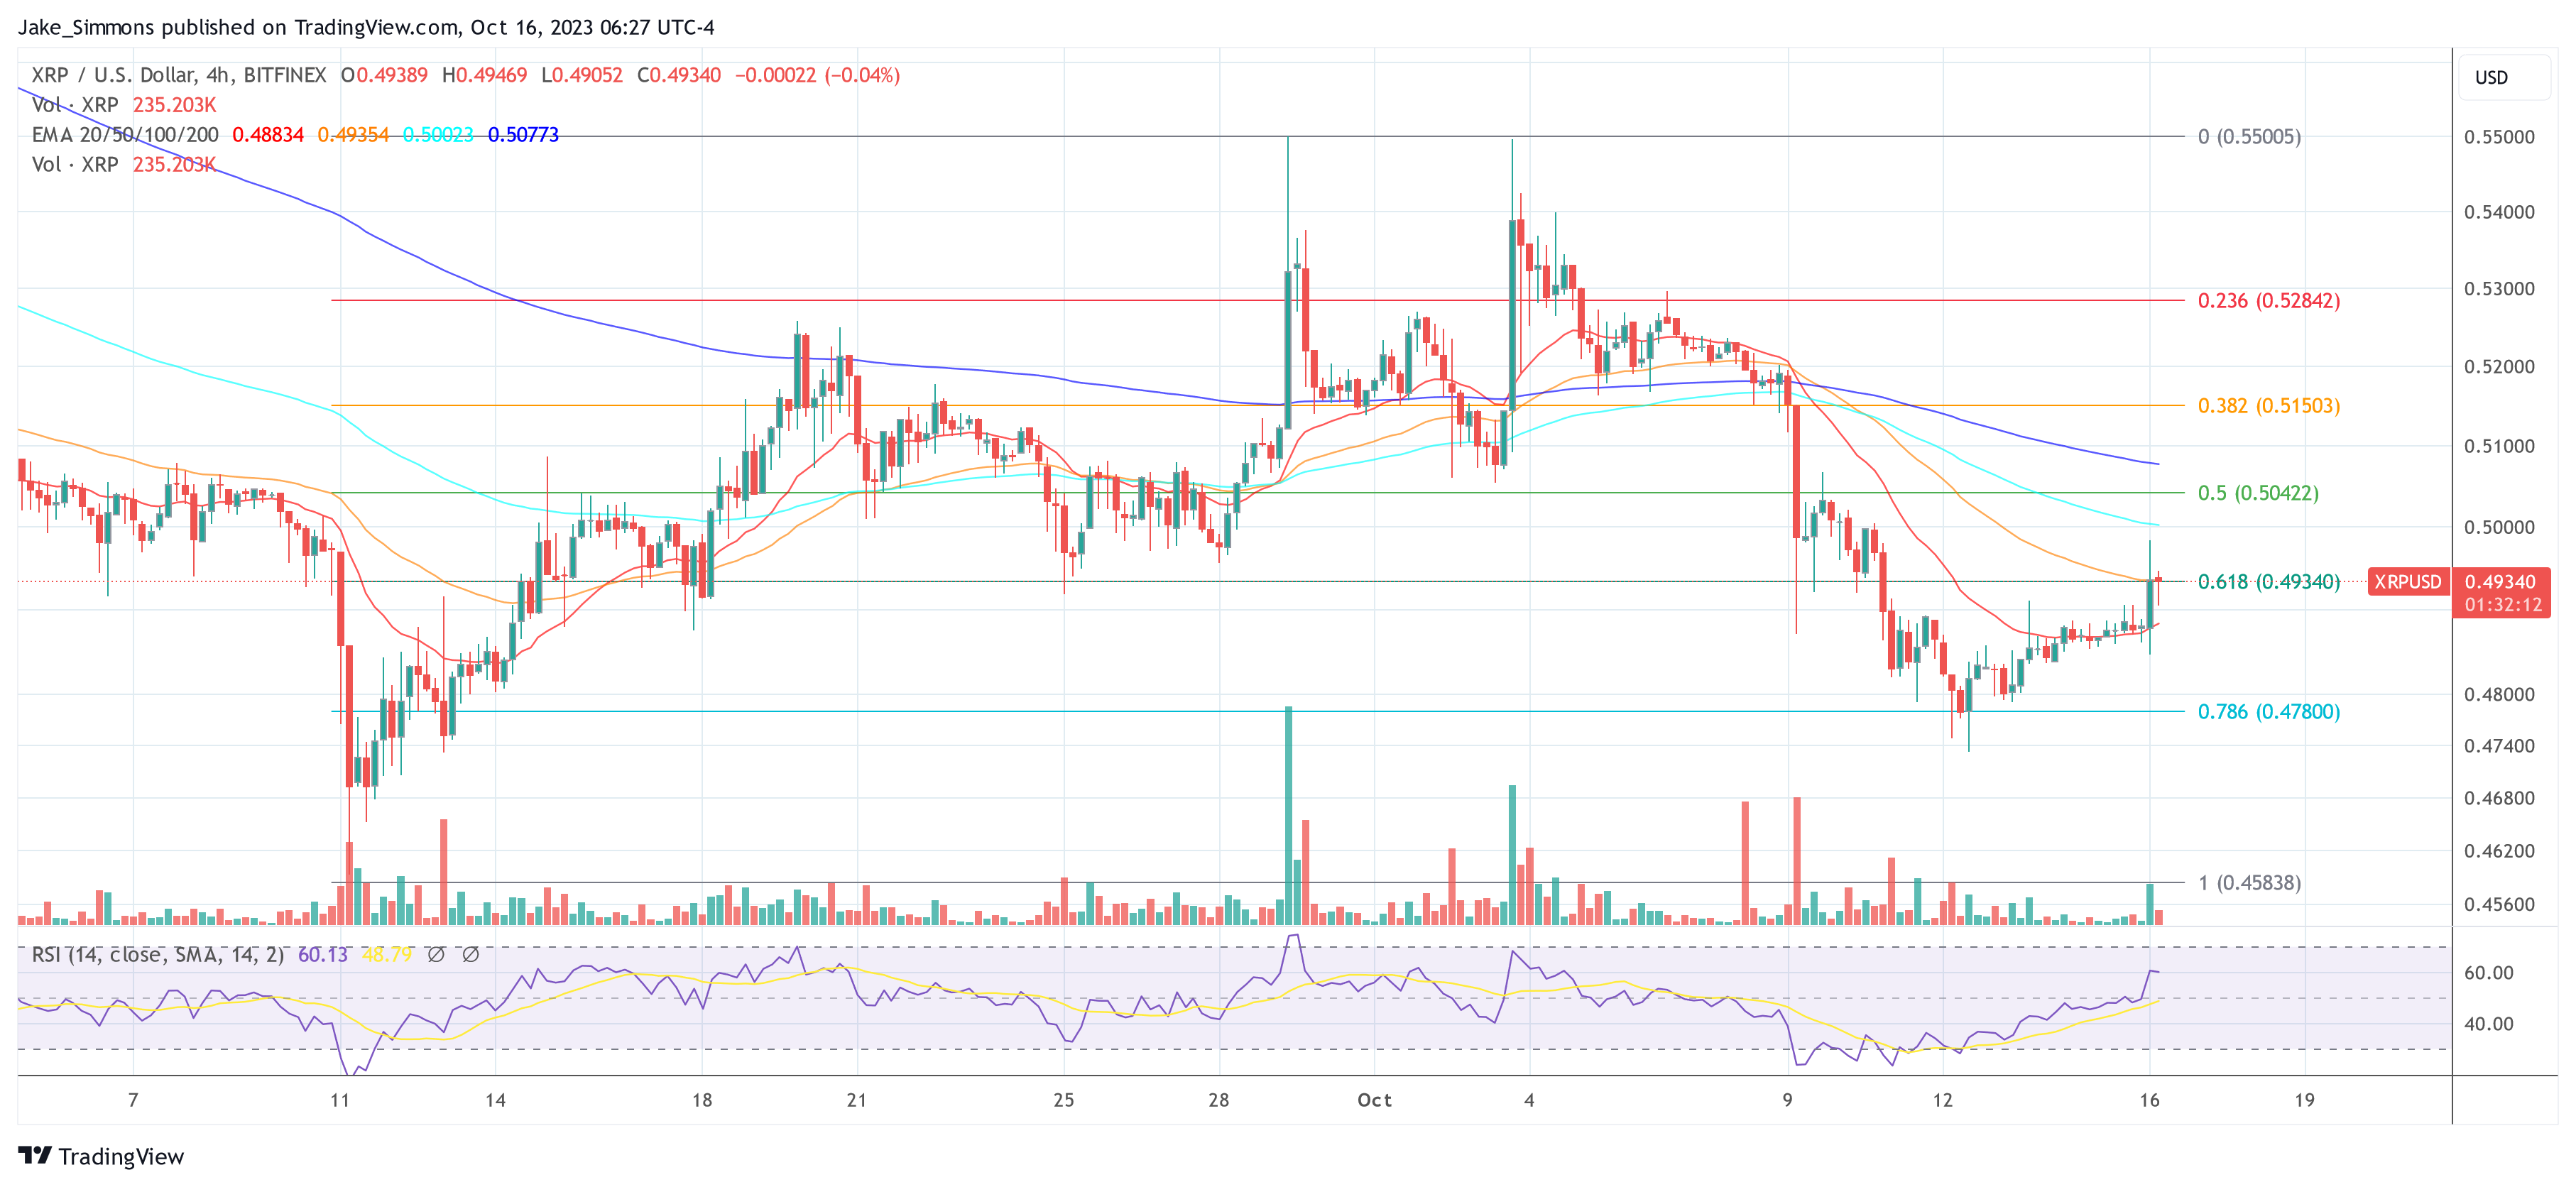
At press time, XRP traded at $0.4934.

Featured image from Figma, chart from TradingView.com


