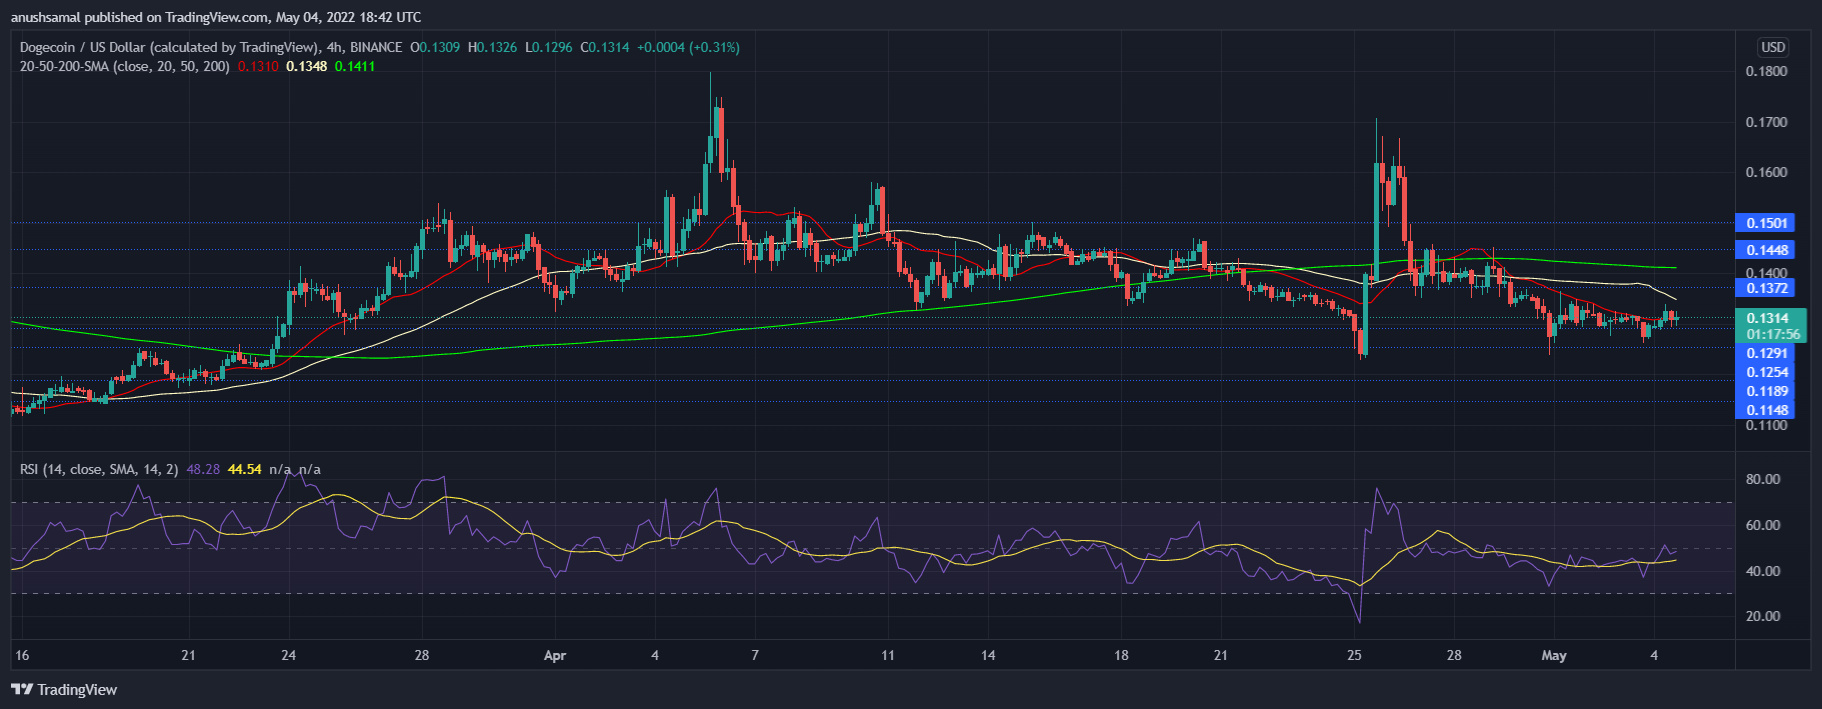
Dogecoin, the largest meme-coin by market capitalisation has bled for close to a week now. Prices of the coin have looked bearish in the last 24 hours and continued to look negative at press time. In the past week, Dogecoin lost 4.9% because of falling buying strength.
The bulls have stayed out of the charts since the beginning of this month. If the current price action persists, Dogecoin would aim for its nearest support line. Bears have taken control of the market as investors have continued to flee the market.
Compared to last year at the same time, Dogecoin has plummeted by 82% from its all-time high of $0.73. Not just investors, the Federal Open Market Committee’s meeting related to hiking interest rates has also kept investors on their toes.
Dogecoin Price Analysis: Four Hour Chart
Dogecoin was priced at $0.131 at the time of writing. The coin had held prices above the support line of $0.131 quite well because meme-coin barely fell below that price in the past month. Over the past few weeks, Dogecoin has seen relatively choppy price action.
Price recovery for Dogecoin has been brief because right after the coin soared in the last week of the past month, it has been unable to hold onto the price momentum. The meme-coin displayed bearish engulfing candlesticks twice on its charts and every time after that reading, prices have slid.
Sell-off of the asset doesn’t seem unnatural as it is quite a common scenario after bearish engulfing candlesticks. Prices can continue to move lower than their current level. Immediate support for the coin stood at $0.129 and then at $0.118.
Dogecoin last traded near the $0.118 price level in March. On the flip side, the coin could target $0.14 if the bulls come around.
Related Reading | Dogecoin Displays A Falling Wedge Pattern; Here’s What It Means
Technical Analysis

The bulls in the market tried to find their way back over the last trading sessions as the coin attempted to trade above the 20-SMA line. Trading above the 20-SMA line also means a recovery in buying strength in the market.
This means that with increased demands prices could be pushed above the 20-SMA line. At press time, however, sellers outnumbered buyers in the market. The Relative Strength Index also noted a small uptick which corresponds with an increased number of buyers but at the time of writing, buying strength remained low.

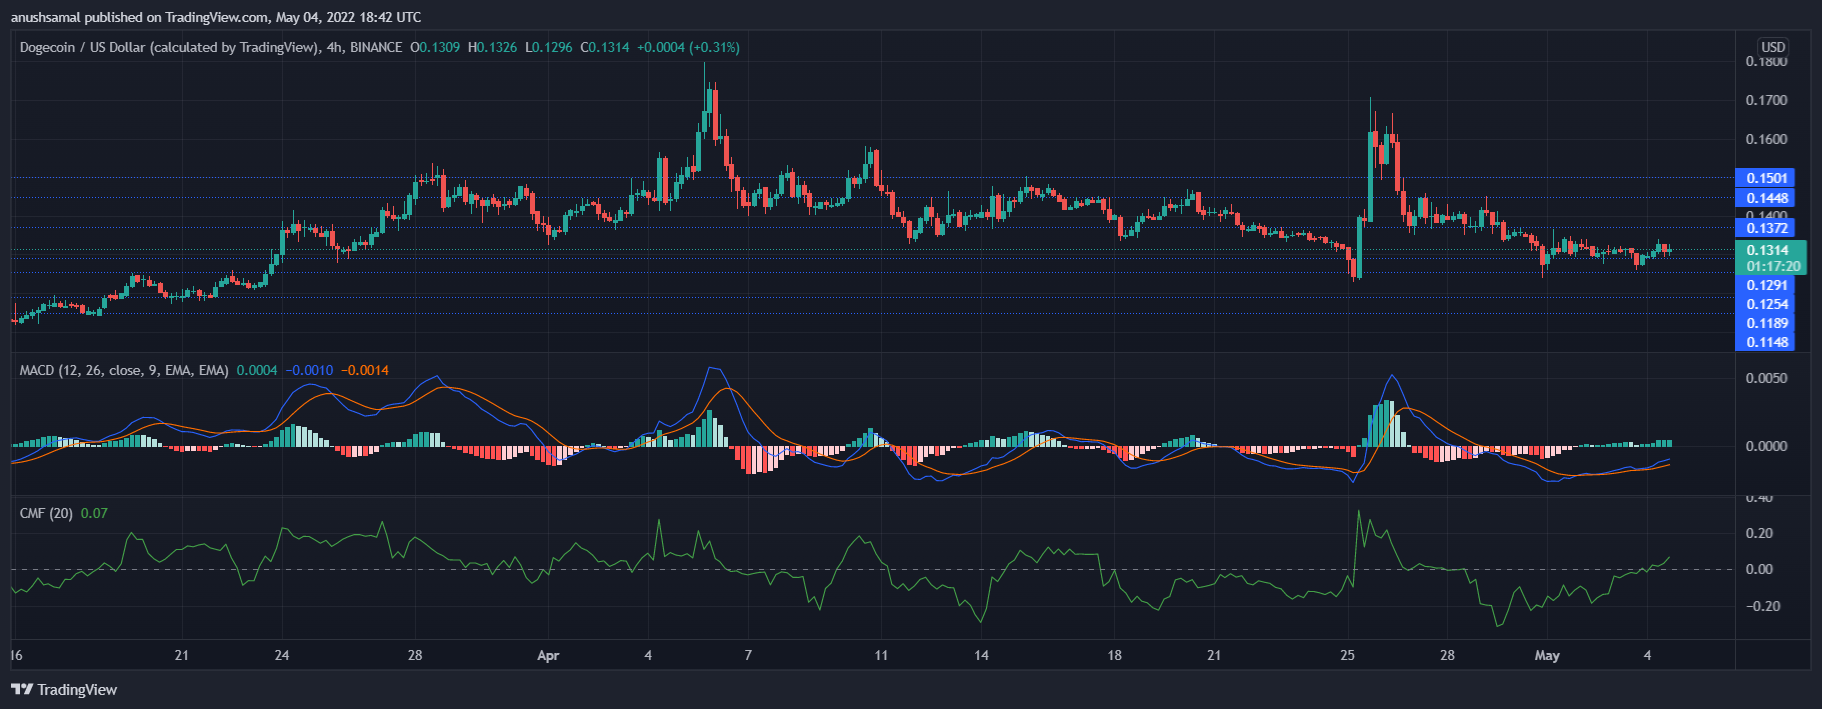
MACD and Chaikin Money Flow, both have a different picture to paint for the meme-coin. Both the indicators pointed towards a positive reading at the time of writing.
MACD, which determines the market momentum underwent a bullish crossover and displayed green histograms signalling that prices have turned bullish. It is still quite early to put a finger on that as the indicator could be giving off signals based on the past immediate trading sessions where DOGE tried to recover.
Chaikin Money Flow indicates the capital inflows and capital outflows. The indicator was seen above the half-line signifying that capital inflows have experienced an increase.
Over the short-term, DOGE has depicted a bearish price action, however, demand from investors could drive the bears away over the upcoming trading sessions.
Related Reading | Bitcoin Gives Bullish Clues, Will The FED Meeting Get In The Way?
Featured image from UnSplash, chart from TradingView.com


