Data shows the current stretch of Bitcoin fear has surpassed that during the 2021 selloff as market continues to be extremely fearful.
Bitcoin Fear And Greed Index Shows Market Sentiment Is Again Extremely Fearful This Week
As per the latest weekly report from Arcane Research, sentiment among BTC investors has once again been that of extreme fear this week.
The “fear and greed index” is an indicator that tells us about the general sentiment currently among Bitcoin holders.
The metric uses a numeric scale that goes from one to hundred for representing this sentiment. All values above fifty signal “greed” in the market, while index values below the cutoff imply holders are fearful right now.
Extreme values of above 75 and below 25 indicate market sentiments of extreme greed and extreme fear, respectively.
Historically, Bitcoin tops have usually formed while investors are extremely greedy. Similarly, bottom formations have taken place during periods of extreme fear.
Because of this, some investors think buying during extreme greed is the best, while extreme fear is ideal for selling.
Related Reading | 82% Of Bitcoin Short-Term Holder Supply Now In Loss, Capitulation Ahead?
This investment philosophy is called “contrarian trading.” Warren Buffet sums it up the best: “Be fearful when others are greedy, and greedy when others are fearful.”
Now, here is a chart that shows the trend in the Bitcoin fear and greed index over the past year:
The indicator's value seems to be around 21 at the moment | Source: Arcane Research's The Weekly Update - Week 10, 2022
As you can see in the above graph, the Bitcoin fear and greed index has been in fear (usually extreme fear) territory since November 2021 now, with the exception of a couple spikes to neutral values (around 50) that lasted very brief.
This stretch of fear is now longer than the one following the selloff last year between May 2021 and July 2021. Currently, the metric has a value of 21, indicating the market is extremely fearful.
Related Reading | Bitcoin Detractor Peter Schiff Lays On What Will Trigger Bitcoin Recovery
Last week as well the general investor sentiment was that of extreme fear. If contrarian investing is anything to go by, periods like now may be a good time to buy more Bitcoin.
The macro uncertainties looming over the market like the Russian invasion of Ukraine may be fueling the current fear sentiment. Right now, it’s hard to say when greed may return among BTC investors.
BTC Price
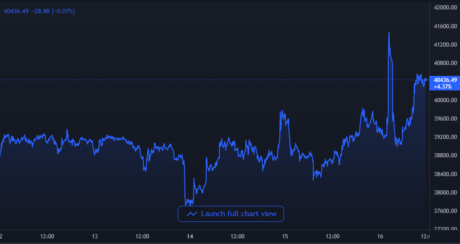
At the time of writing, Bitcoin’s price floats around $40.4k, down 4% in the last seven days. The below chart shows the trend in the price of BTC over the last five days.
BTC's price looks to have surged up over the past 24 hours | Source: BTCUSD on TradingView
Featured image from Unsplash.com, charts from TradingView.com, Arcane Research


