Solana-based memecoin BONK has enjoyed a rally of more than 18% today, but the asset may be in trouble if this sell signal is to go by.
BONK Has Formed A TD Sequential Sell Signal On Its Weekly Chart
As explained by analyst Ali in a post on X, the same indicator that signaled the latest rally for BONK is now predicting a decline for the cryptocurrency instead. The metric in question is the “Tom Demark (TD) Sequential,” which is generally used for pinpointing probable tops and bottoms in any asset’s price.
The indicator gives such a reversal signal after nine candles of the same type are following a previous top/bottom in the asset. This nine-candle phase is called the “setup.”
If the setup completes with nine red candles, then the TD Sequential suggests a likely buying point, while green candles imply the asset might have encountered a top.
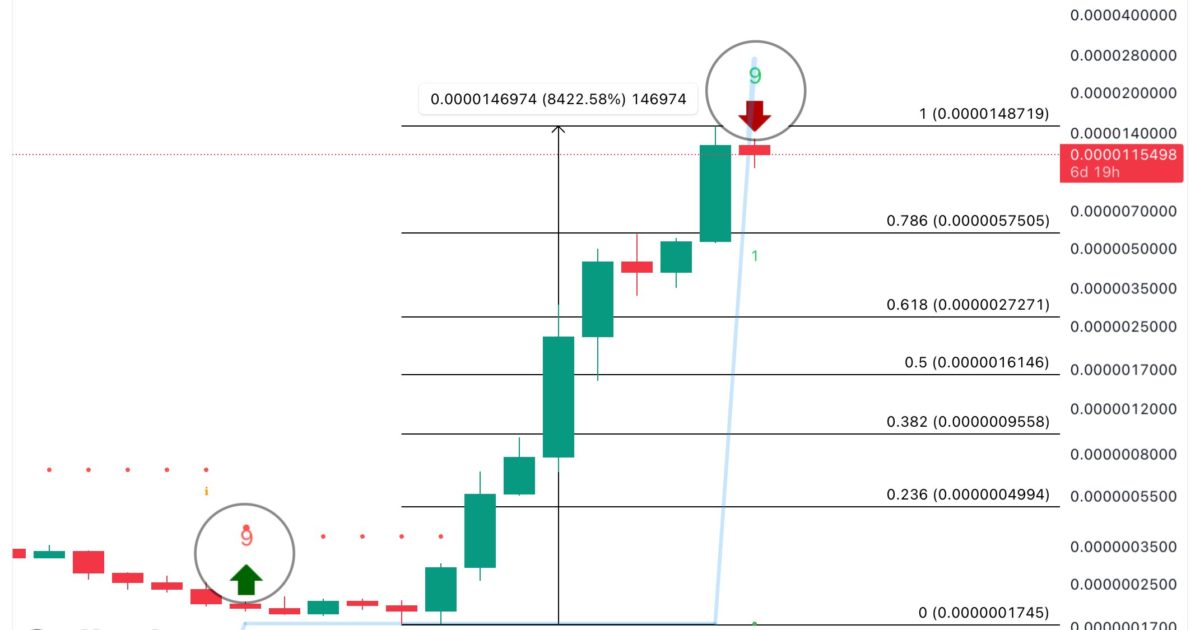
A TD Sequential setup has been completed for memecoin BONK on its weekly price chart just recently. Here is the chart shared by the analyst that shows this pattern in the cryptocurrency:
Looks like the signal has completed with green candles recently | Source: @ali_charts on X
As displayed in the above graph, the weekly BONK price has completed a TD Sequential setup phase with green candles recently as the asset has been enjoying a sharp rally.
Ali notes that a few months ago, the same indicator had presented a buy signal for the meme coin, which ended up leading to the current rally. So far, the asset has enjoyed profits of more than 8,400% during this run.
The analyst thinks based on the latest TD Sequential sell signal, BONK may be heading towards a correction period that could last anywhere from one to four weeks.
The Dog-Based Coin Has Registered A Rise Of Over 18% During The Past Day
During the weekend, BONK continued its recent bullish momentum and made a push above the $0.00001487 mark, but the meme coin soon noticed a sharp correction as it plunged to $0.00000996.
The bulls appear to be back for the coin, though, as it has seen a rapid 18% recovery in the last 24 hours, reclaiming the $0.00001237 level. The below chart shows how the token has performed during the past month.
The price of the asset appears to have gone through a sharp rally in this period | Source: BONKUSD on TradingView
BONK is still a decent distance from making a full retrace towards its top, however, so it’s hard to say anything about whether this fresh rally is going to last for any sizeable period.
And given the TD Sequential sell signal in the weekly chart, it’s possible that this recovery surge is just a dead-cat bounce, and BONK will be heading down from here instead.
At present, the meme coin is up more than 364% during the past month and stands third on the top meme coins by market cap list, meaning that it’s only smaller than Dogecoin (DOGE) and Shiba Inu (SHIB) in total valuation.
Featured image from Shutterstock.com, charts from TradingView.com


