Bitcoin (BTC) has been trapped in a symmetrical triangle for 56 days and the trend change could last until early May, according to price technicals.
Currently, the support level stands at $38,000, while the triangle resistance for daily close stands at $43,600.
Bitcoin mining up, retail interest down
The week started with a positive achievement for the Bitcoin network as the Lightning Network capacity reached a record-high 3,500 BTC. This solution allows extremely cheap and instant transactions on a secondary layer, known as off-chain processing.
After cryptocurrency mining activities were banned in China in 2021, publicly-listed companies in the United States and Canada attracted most of this processing power.
As a result, Bitcoin’s hash has recovered dramatically since the summer. It’s currently at all-time highs at over 200 EH/s. According to the Cambridge Bitcoin electricity consumption index, 45% of the global hash rate derives from North America.
Furthermore, Whit Gibbs, the founder and CEO of Compass Mining, stated that “public mining companies definitely have an advantage when it comes to holding Bitcoin because they have access to the capital markets.” In addition, there is less selling pressure as miners’ reserves have been steadily increasing.

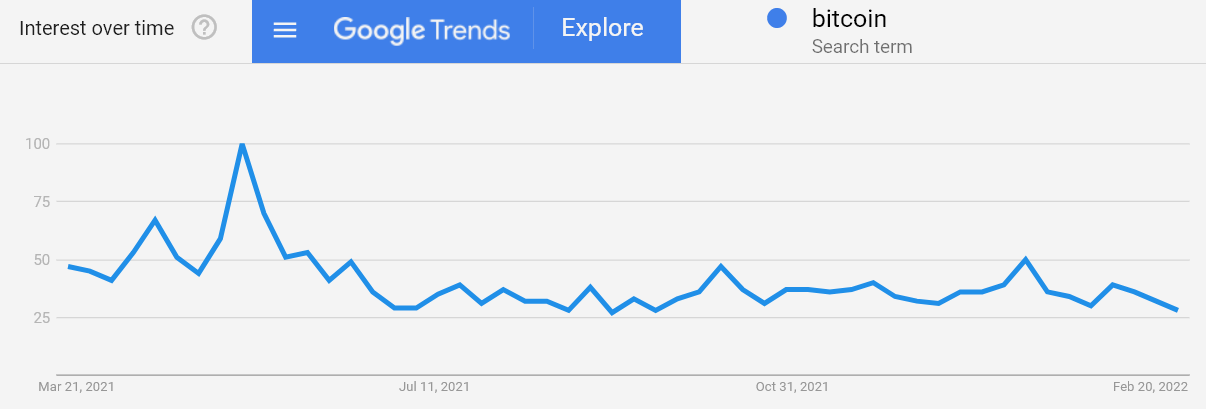
Meanwhile, searches for “Bitcoin” on Google are nearing their lowest levels in 12 months. This indicator could partially explain why Bitcoin is 41% below its $69,000 all-time high, i.e., public interest is low. Still, one needs to analyze how professional traders are positioning themselves, and there’s no better gauge than derivatives markets.
Related: Crypto miner Hut 8 posts record revenue as BTC holdings surge 100%
Long-to-short data confirms lack of excitement
The top traders’ long-to-short net ratio excludes externalities that might have impacted specific derivatives instruments. By analyzing these top clients’ positions on the spot, perpetual and futures contracts, one can better understand whether professional traders are leaning bullish or bearish.
There are occasional methodological discrepancies between different exchanges, so viewers should monitor changes instead of absolute figures.

Bitcoin might have jumped 8% since March 13, but professional traders did not increase their bullish bets according to the long-to-short indicator. For instance, Huobi’s top traders’ ratio slightly decreased from 1.10 to the current 1.06 level.
Moreover, OKX data shows those traders reducing their longs from 1.26 to 1.03 significantly reducing their longs. Binance was the only exception, as top traders increased their longs from 1.05 to 1.13. Still, there has been a slight 0.06 decrease across the three major exchanges on average.
Can the triangle break to the upside?
From the perspective of the metrics discussed above, there is hardly any sense that Bitcoin price will flip bullish in the short-term. Data suggests that pro traders have reduced their long positions, as expressed by the basis rate and long-to-short ratio.
Moreover, the broader Google search trend signals retail interest is not picking up despite high inflation data and global socio-political uncertainties. For now, the odds of the symmetrical triangle breaking for the upside seem dim.
The views and opinions expressed here are solely those of the author and do not necessarily reflect the views of Cryptox. Every investment and trading move involves risk. You should conduct your own research when making a decision.


