BTC price action may stay cool until October 12, one analyst argues, as a historical volatility indicator prints a rare warning signal.
Bitcoin (BTC) trading was unmoved at the Oct. 10 Wall Street open as one trader predicted it would take until Oct. 12 for volatility to start impacting price.

A “guaranteed recipe for massive volatility”
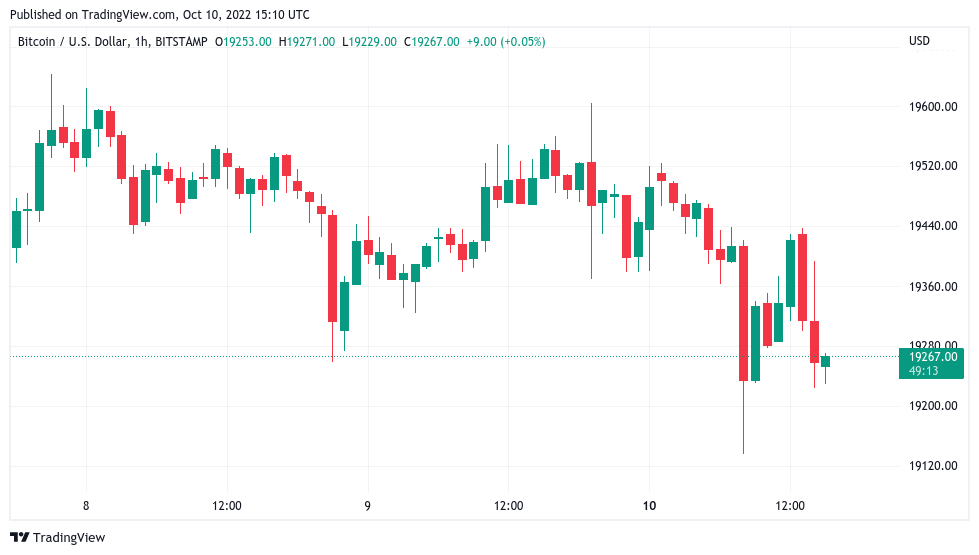
Data from Cointelegraph Markets Pro and TradingView showed BTC/USD circling $19,300 at the time of writing.
The pair had stayed rigidly in a narrow corridor over the weekend, with only one test of $19,000 punctuating otherwise flat conditions.
With the week tipped to provide serious fuel for a potential volatility breakout, Michaël van de Poppe, founder and CEO of trading firm Eight, suggested that traders may get another 48 hours’ grace.
“Most likely markets will remain unchanged until we’ll get all the economic data in on Wednesday and Thursday,” he summarized on the day.
Van de Poppe nonetheless reiterated that when it comes, the move on Bitcoin should be “very big.” He referenced the Bitcoin historical volatility index (BVOL), currently at rare lows seen only a handful of times before.
“Historically, that’s a guaranteed recipe for massive volatility,” he wrote in part of an explanatory tweet.
Oct. 13 was analysts’ overall red letter day of the week, meanwhile, with theConsumer Price Index (CPI) print for September due in the United States.
U.S. equities were broadly quiet at the time of writing, the S&P 500 down 0.6% and Nasdaq Composite Index down 1.1%.
Continuing, on-chain analytics resource Material Indicators said that macro data would spark knock-on moves for both volatility and market participation.
“Earnings, CPI, Jobless and Retail Sales reports are going to fuel an increase in both of these crypto market metrics,” it tweeted on the day.
A previous post from Material Indicators’ founder, Material Scientist, revealed that volatility and the number of trades had hit one-year lows.
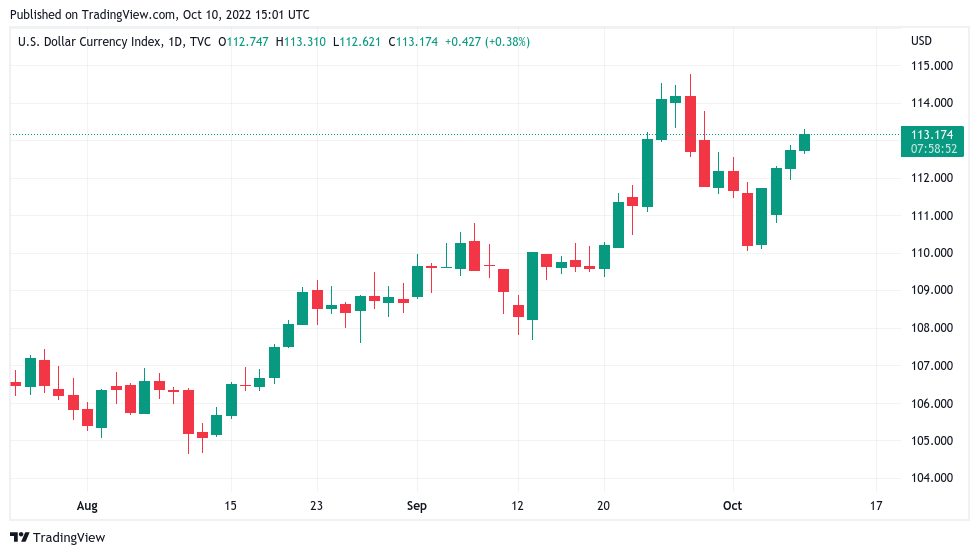
In a separate sign of a storm brewing, the U.S. dollar index (DXY) was gaining once again on the day, having made up much lost ground after hitting its highest levels since May 2002.

DXY hit $113.31 on the day, with the peak from Sept. 28 at $114.77.
Hash rate lingers as difficulty hits new all-time high
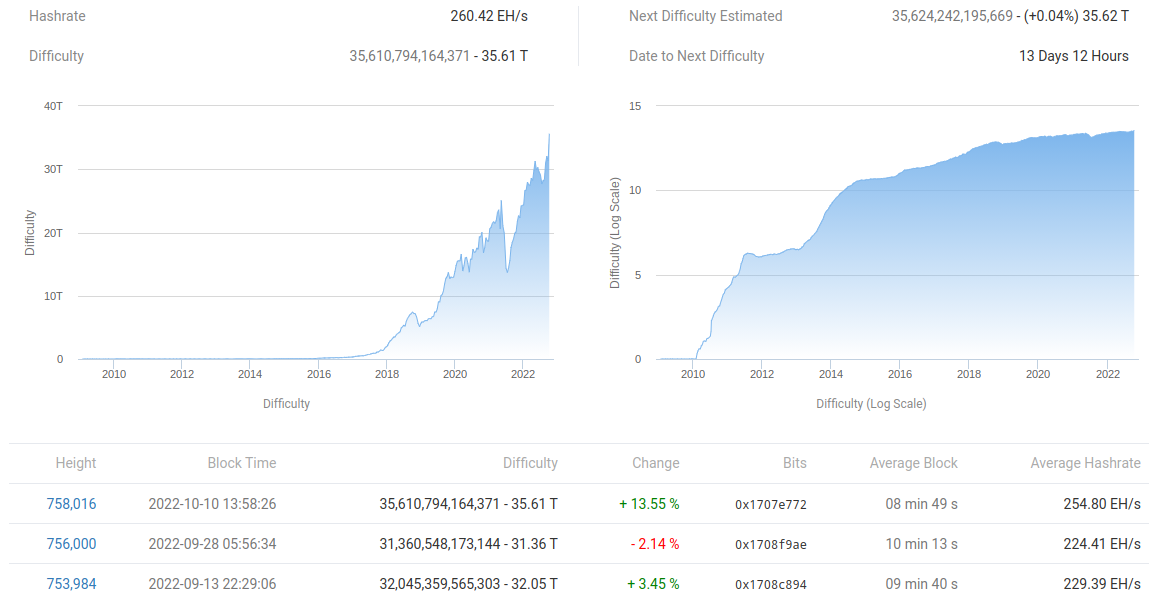
Meanwhile, after two weeks in the making, a giant difficulty readjustment saw Bitcoin’s key fundamental metric rise 13.55%.
Related: Biggest mining difficulty spike in 14 months — 5 things to know in Bitcoin this week
Despite financial pressure on miners due to tsuppressed spot price, the move was the Bitcoin network’s largest positive adjustment since May 2021.
At the time, however, its progress was short lived, with successive losses subsequently accompanying market nerves as the China miner exodus began.

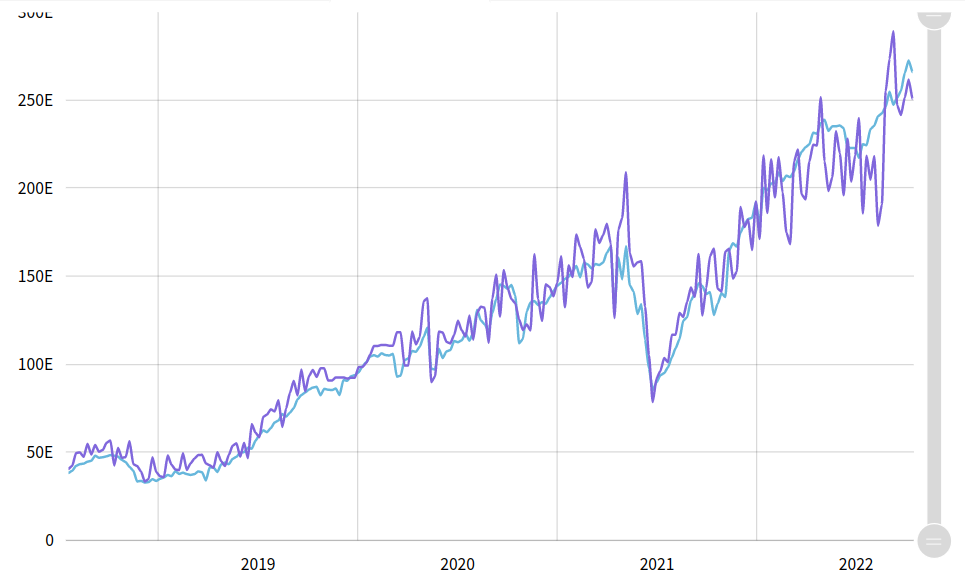
The network hash rate was an estimated 260 exahashes per second (EH/s) at the time of writing, data from on-chain monitoring resource MiningPoolStats putting the all-time high at 289 EH/s on Sept. 5.

The views and opinions expressed here are solely those of the author and do not necessarily reflect the views of Cointelegraph.com. Every investment and trading move involves risk, you should conduct your own research when making a decision.


