The waiting game continues for crypto traders after Bitcoin (BTC) is once again pinned below resistance at $43,000 and awaiting some spark in momentum that can sustain a rally back to the $50,000 range.
Data from Cryptox Markets Pro and TradingView shows that the price of Bitcoin has traded in a range between $41,500 and $43,000 over the past couple of days and with tensions between Ukraine and Russia escalating, many traders are less than optimistic about Bitcoin’s short-term prospects.
Here’s a look at what analysts are saying about their short-term expectations for Bitcoin price.
Is Bitcoin on a path to zero?
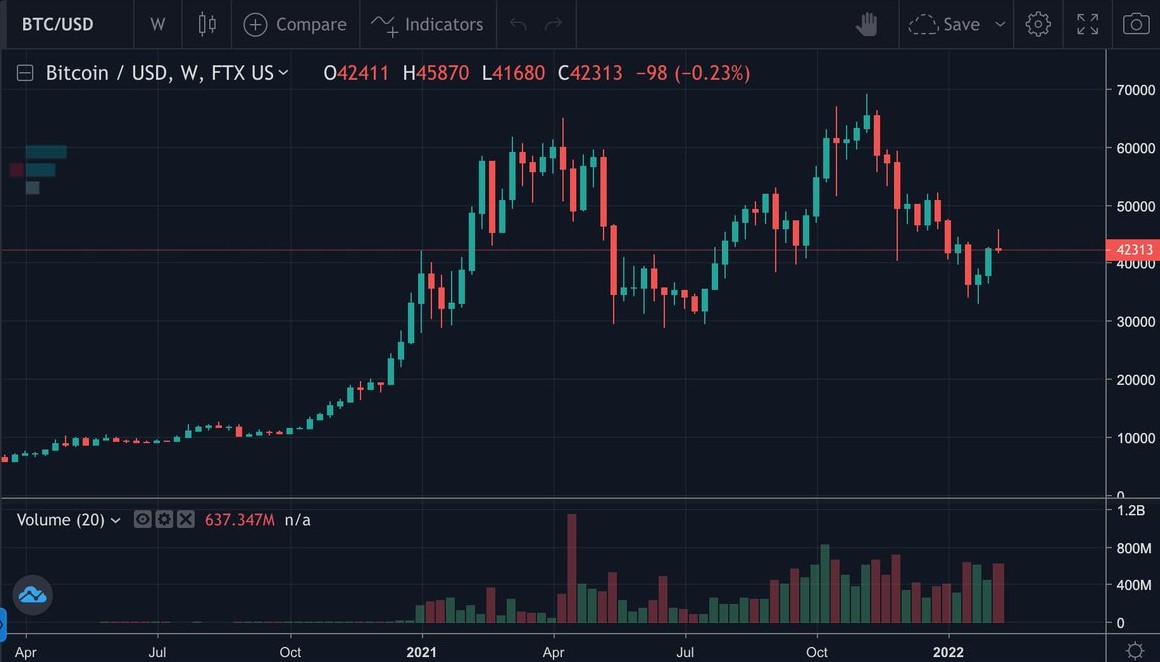
Well-known cryptocurrency perma-bear Peter Schiff made sure to chime in on the latest struggles for Bitcoin by posting the following chart pointing to a double top on BTC as a sign that the digital asset is set to drop to $0.

Schiff asked followers to “imagine how bad this chart will look once Bitcoin breaks below $30,000,” and he direly predicted that “If this double top completes, the real floor is zero!”
Schiff said,
“A drop to $10,000 would seem like a lock, but there’s no reason to believe that level would hold up as a permanent floor.”
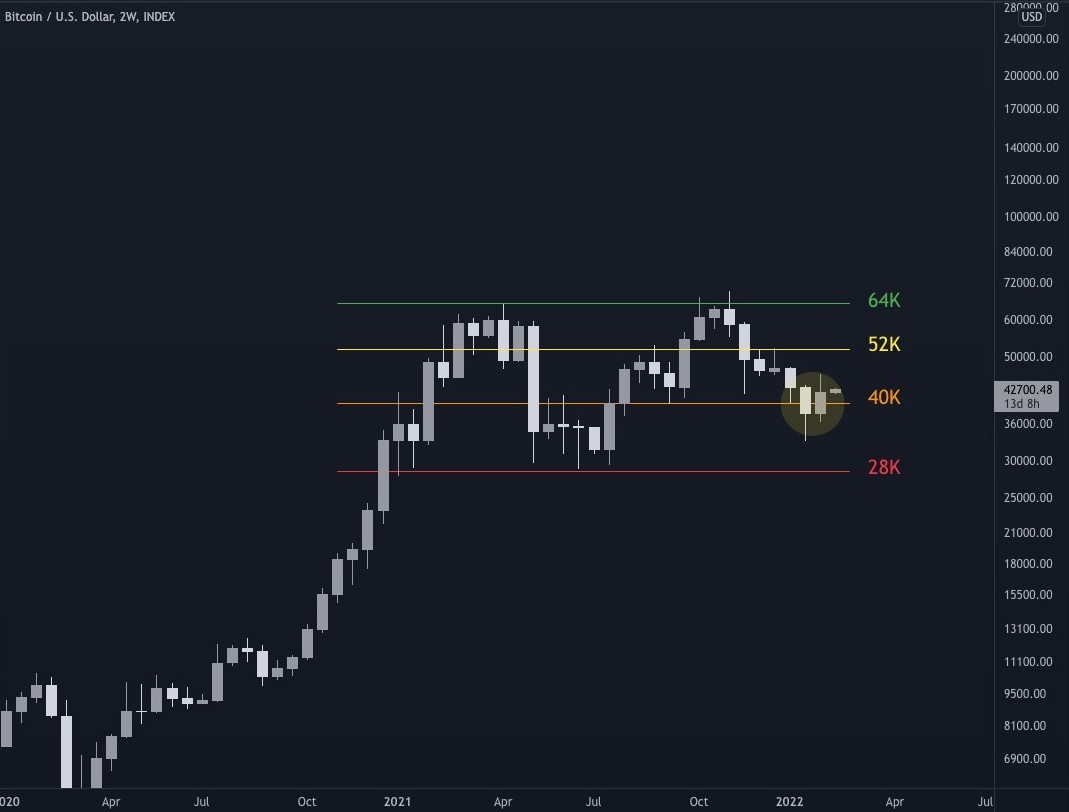
A more in-depth read on the current chart formation was provided by crypto analyst and pseudonymous Twitter user TechDev, who posted the following chart, which divides the “year-long BTC range” into two-week-long sub-ranges.

TechDev said,
“Closing outside one has granted weeks of price action in the next. Yesterday’s 2W close above $40,000 suggests the previous close was a deviation. Current 2W key in determining which sub-range we’ll be spending the next few weeks.”
“Bullish crossover happening now”
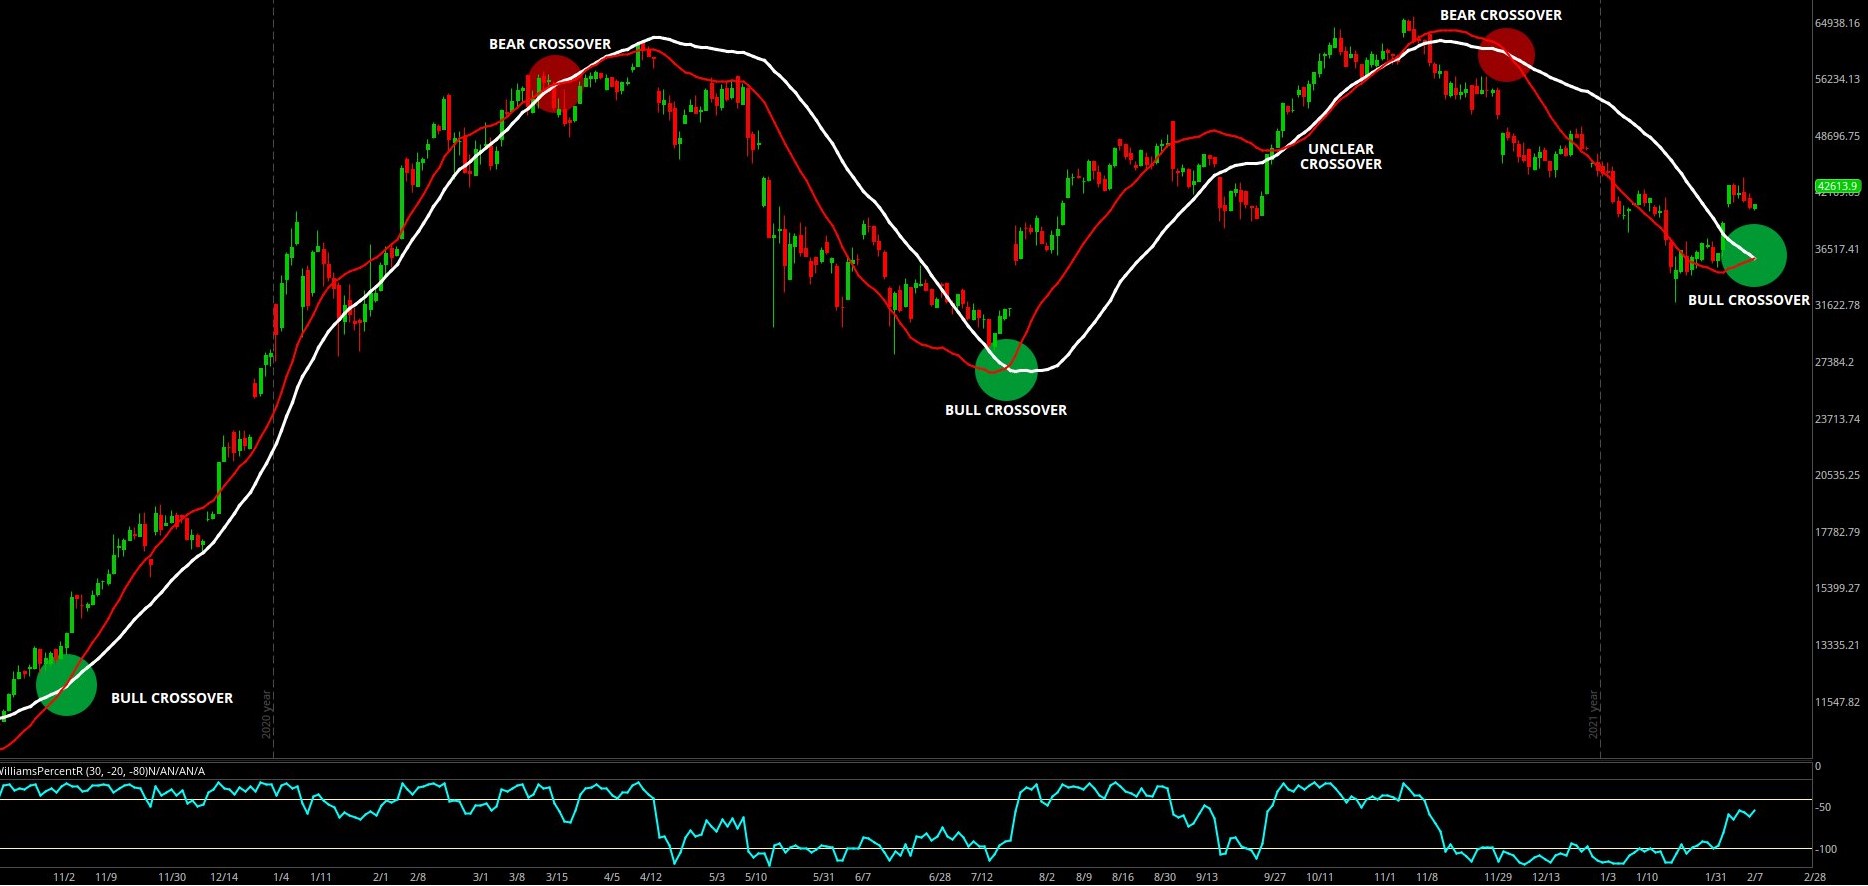
Evidence that the price of Bitcoin could soon start heading higher was noted by market analyst Caleb Franzen, who posted the following chart looking at the daily candles for BTC since October 2020.

Franzen said,
“The red & white indicators use linear regression analysis to measure the slope of the regression on different time frames (slow vs. fast). Crossovers are bullish/bearish depending on the direction. Bullish crossover happening now…”
Related: Bitcoin kisses 50-day moving average as trader predicts fresh BTC price volatility
Was the dip below $40,000 a bear trap?
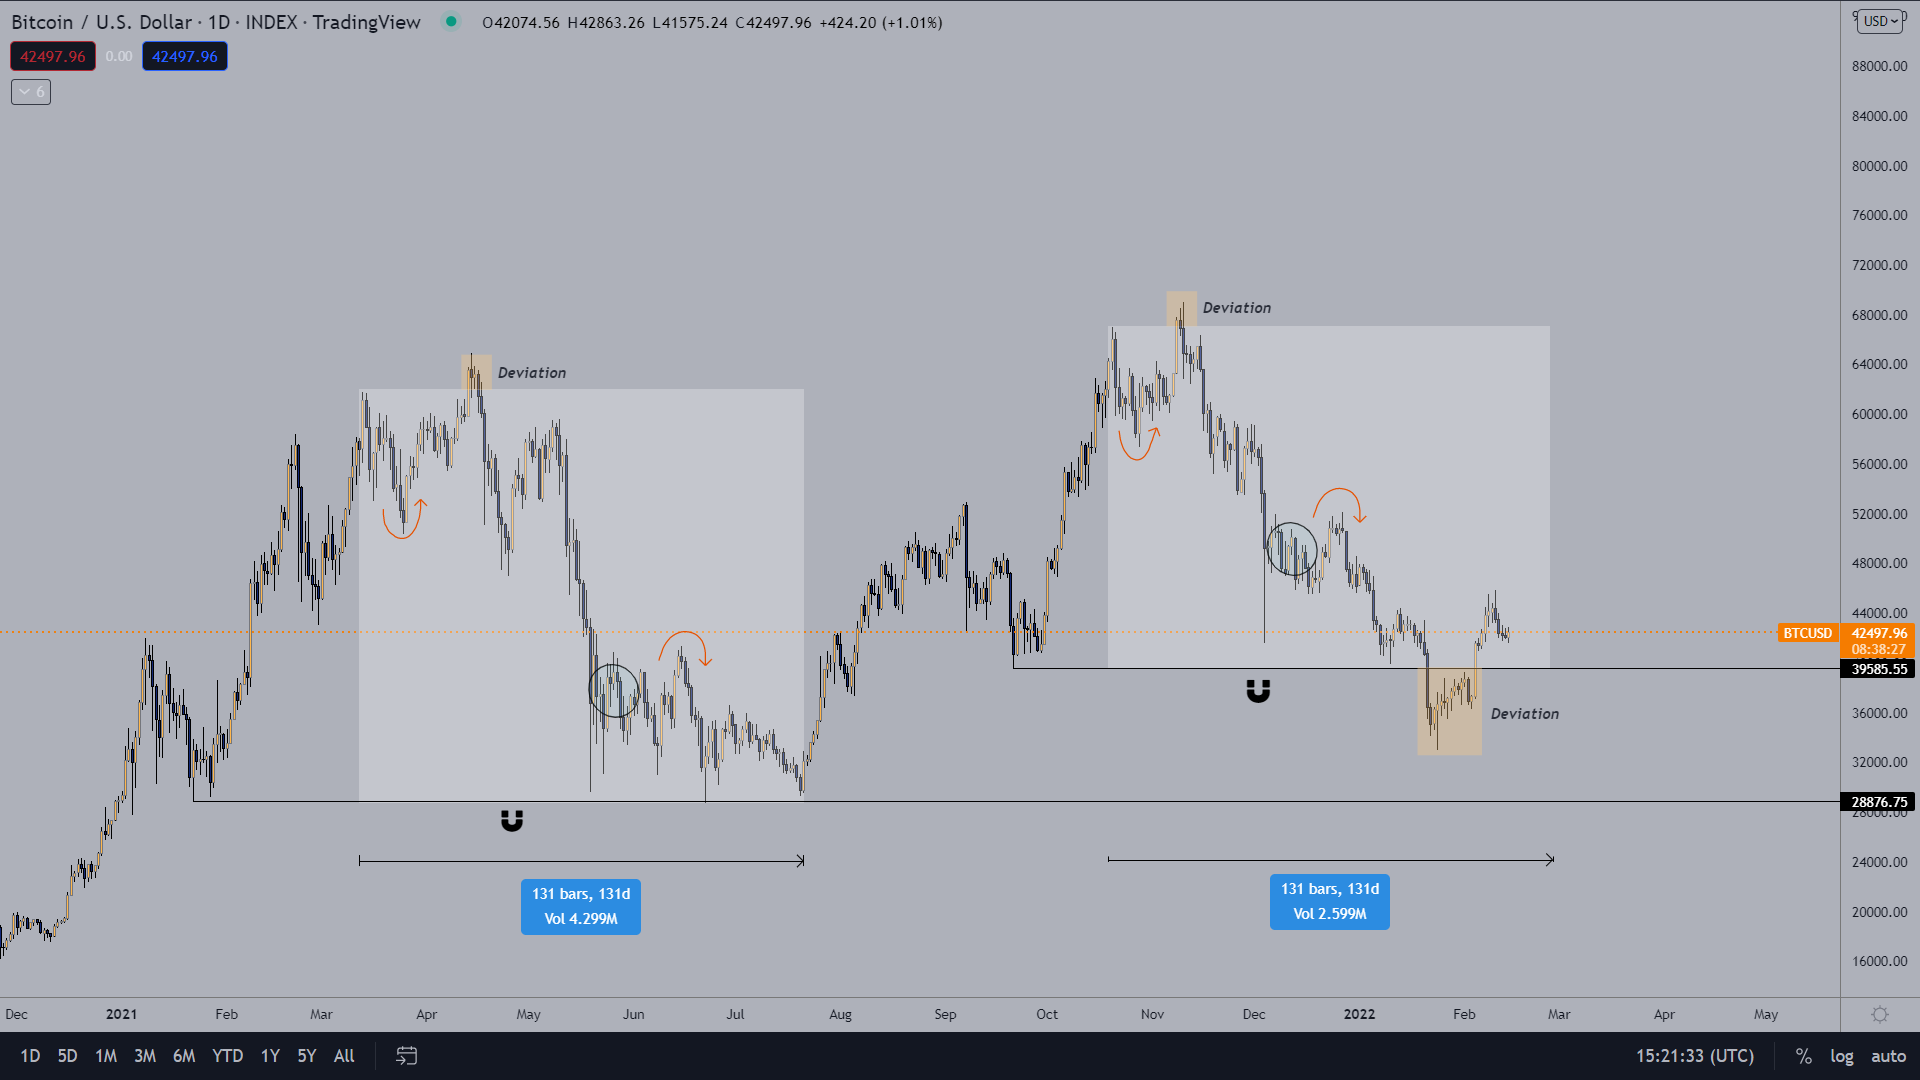
The recent dip in BTC price below support at $40,000 was addressed by crypto trader and pseudonymous Twitter user Phoenix, who posted the following chart suggesting the dip was a deviation designed to “suck in traders on the wrong side” and “trap breakout traders” by making them “load higher/lower targets.”

Phoenix said,
“History doesn’t repeat, but it often rhymes. Chances are there that this was just another deviation. At least the sentiment matched near the lows, that’s for sure.”
The overall cryptocurrency market cap now stands at $1.892 trillion and Bitcoin’s dominance rate is 42.5%.
The views and opinions expressed here are solely those of the author and do not necessarily reflect the views of Cryptox.com. Every investment and trading move involves risk, you should conduct your own research when making a decision.


