On-chain data shows Bitcoin holders have done some rapid fresh accumulation recently, something that may lead to bottom formation for the cycle.
Bitcoin 1w-1m Realized Cap UTXO Age Bands Have Sharply Gone Up
As pointed out by an analyst in a CryptoQuant post, the percentage of the BTC realized cap that was last moved between 1 week to 1 month ago has displayed rapid uptrend for the first time in this bear.
The “realized cap” is a Bitcoin capitalization model that values each coin in the circulating supply using the price at which it was last moved. The metric then calculates the “true valuation” of BTC by summing up all these values of the individual coins.
This is different from the normal market cap, where every coin in circulation has the same one value; the current Bitcoin price.
The “realized cap – UTXO age bands” is an indicator that tells us the distribution of the realized cap of each age band in the market.
These age bands specify ranges between which UTXOs (or more simply, coins) falling into said age band were last moved.
The relevant age band here is the 1w-1m group, which includes all UTXOs that were last moved within 1 week to 1 month ago.
Here is a chart that shows how the percentage of the realized cap contributed by this age band has changed over the years:
Looks like the value of the metric has sharply gone up in recent weeks | Source: CryptoQuant
As you can see in the above graph, the realized cap of the 1w-1m Bitcoin UTXO age band has observed some rapid uptrend recently.
The older end of this range, that is, one month ago, is around when the crash due to the FTX collapse took place.
The indicator’s value rising thus suggests that investors have done some fresh accumulation at the lows following this crash.
This is the first time in this Bitcoin bear market that such rapid new accumulation has taken place.
From the chart, it’s apparent that such rises have historically coincided with cyclical lows in the price. Another interesting thing to note is that between these spikes in the metric during the previous two cycles, there were 1358 days.
The current rise has come 1444 days after the last one, which is a similar length as the gap before. If there really is a pattern here, then the Bitcoin bottom may be very close, if not already in.
BTC Price
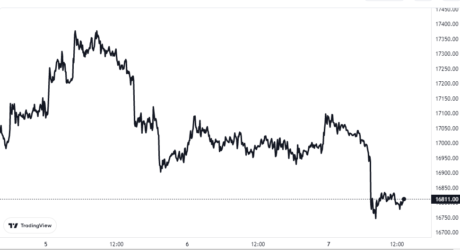
At the time of writing, Bitcoin’s price floats around $16.8k, down 1% in the last week.
BTC plunges down | Source: BTCUSD on TradingView
Featured image from Kanchanara on Unsplash.com, charts from TradingView.com, CryptoQuant.com


