- A five-minute price rally took bitcoin above $9,400 on January 28.
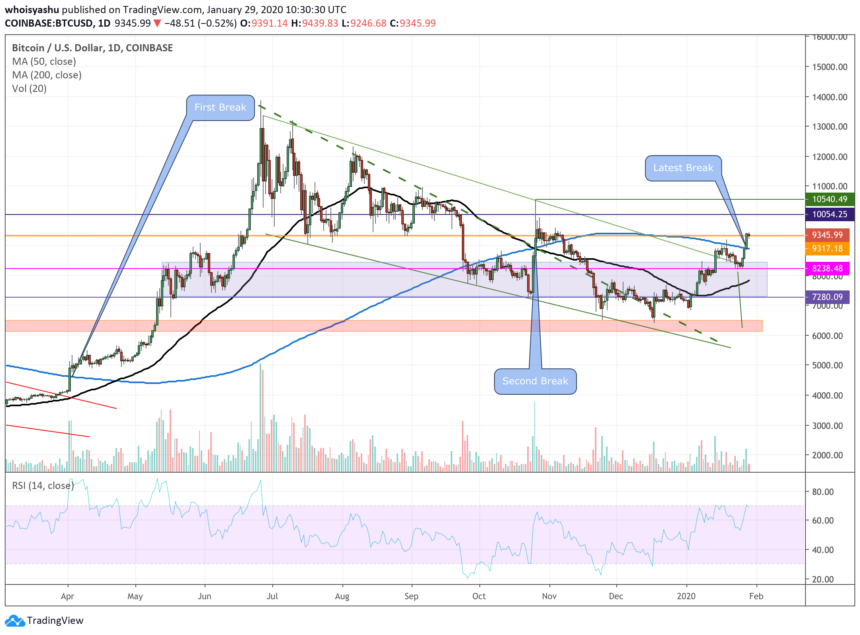
- The move upside helped the cryptocurrency break above a long-term resistance area.
- Earlier in November, bitcoin had broken above the same price ceiling but failed to sustain its upside momentum.
Bitcoin was among the only few assets that managed to post gains amidst uncertain macroeconomic conditions.
The benchmark cryptocurrency surged above $9,400 during London’s pre-midnight session on Tuesday, swelling by more than $300 within a five-minute timeframe. The move uphill came as investors bought haven assets to minimize their exposure in equity markets affected by the Coronavirus fears.
#bitcoin is now up 30% in 2020. It’s hard to say how much of the rise is due to #coronavirus panic. However, some traders seem to be starting to believe a negative correlation between Bitcoin and stocks during times of panic(panic=>declining stock prices). What’s your opinion👇 pic.twitter.com/zkSvwy32j1
— iQuoto (@iQuotoGlobal) January 29, 2020
Another reason that may have pushed the bitcoin price higher is lowered borrowing rates. The Federal Reserve on Wednesday will decide whether to increase, decrease, or neutralize rates for now. The market projects the US central bank could keep the rates unchanged.
A small section of traders considers bitcoin as a hedging asset in times of macroeconomic and geopolitical crisis. On one hand, the Coronavirus outbreak is hammering stock and oil prices down. And on the other, the Fed’s expansionary monetary policy is making cash look like a less attractive asset for investors.
But to a larger section, the latest bitcoin price pump is driven more by technicals than fundamentals.
Key Resistance Area Stands Broken
Prominent macro analyst Mati Greenspan called the bitcoin’s move a “breakout.” He took cues from the invalidation of a long-term bitcoin resistance area, that capped the cryptocurrency’s upside attempts throughout the fourth-quarter of 2019.
Dubbed as the 200-daily moving average (200-DMA), the technical indicator almost served as a bias-flipping alert. When bitcoin jumped above it, the price surged exponentially. Conversely, when the cryptocurrency closed below the 200-DMA, it plunged wildly.
In one of the supporting instances, breaking above the 200-DMA in April last year later took bitcoin up by 197 percent. Similarly, breaking below the indicator crashed the price by 29 percent during Q4/2019.
“The downward Channel is officially pulverized,” said Mr. Greenspan. “At this point, the breakout is clear. The 200 DMA is in the dust.”
BREAKOUT CONFIRMED!!
The downward Channel is Officially Pulverized! 🔥💥🔥
The downward Channel is Officially Pulverized! At this point, the breakout is clear. The 200 DMA is in the dust. Get your rockets & lambos ready bois, we goin to da moon. 🚀🏎️🌛 pic.twitter.com/rDZVPjsKg9
— Mati Greenspan [tweets are not trading advice] (@MatiGreenspan) January 29, 2020
One Potential Downside Risk for Bitcoin
The breakouts above 200-DMA are typically bullish for bitcoin. Nevertheless, such was not a case in November.
The bitcoin-to-dollar exchange rate closed above the technical resistance area on October 26, 2019, to rise 6.83 percent. However, bulls were not able to sustain the price momentum. The move upside turned out to be a fake breakout (or fakeout), showing that the moves above 200-DMA were not always accurately bullish.
Bitcoin would need to hold its January gains even if an easing global market sentiment boost risk-on sentiments. That could confirm that traders are bullish on to the cryptocurrency for broader timeframes – and that the current pump is not a fakeout.
Mr. Greenspan adds that the October-November fakeout borrowed sentiments from China’s President Xi Jinping’s endorsement of the blockchain technology. But this time, the scenario is entirely different.
“The difference is that the Xi-boom was a sudden break. This one was a lot more gradual and ‘earned’ rather than granted. The 200 DMA isn’t going to backtrack its comments about blockchain and bitcoin,” he tweeted.


