

Key points:
-
Bitcoin’s relief rally rose above $108,000, but the bulls may struggle to push and sustain the price above the all-time high of $111,980.
-
Several major altcoins have bounced off their recent lows but are not finding buyers at higher levels.
Bitcoin’s (BTC) relief rally that started on Monday, following US President Donald Trump’s “total ceasefire” announcement between Israel and Iran, rose above $108,000, indicating sustained demand from the bulls.
Institutional investors did not stop buying despite increasing geopolitical tensions in the past few days, as seen from the 11 consecutive days of inflows into US spot Bitcoin exchange‑traded funds (ETFs). According to Farside Investors’ data, the ETFs attracted $3.35 billion in inflows starting June 9.
Bitcoin looks set to challenge the all-time high at $111,980, but the cryptocurrency markets may require a catalyst to hold on to the higher levels. The absence of a trigger may extend Bitcoin’s stay inside the range for some more time.
Could Bitcoin break out to a new all-time high, pulling altcoins higher? Let’s analyze the charts of the top 10 cryptocurrencies to find out.
Bitcoin price prediction
Bitcoin turned up sharply from $100,000 on Monday and rose above the moving averages, indicating solid buying at lower levels.
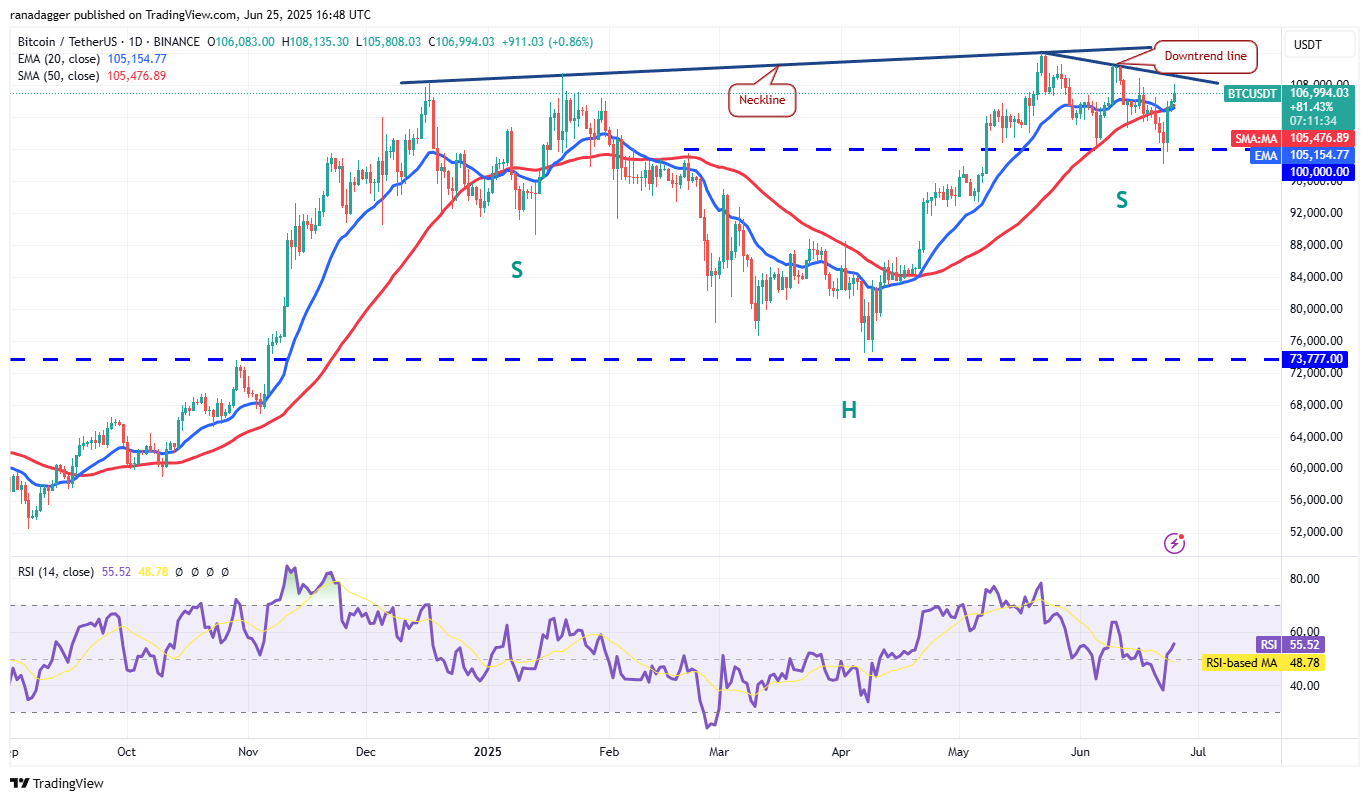
The 20-day exponential moving average ($105,154) has started to turn up, and the relative strength index (RSI) has jumped into positive territory, signaling that the bulls are back in the game. Sellers are expected to defend the zone between the downtrend line and the all-time high of $111,980.
If the price turns down from the overhead zone but finds support at the 20-day EMA, it signals that the bulls are buying on dips. The bulls will then again try to clear the overhead zone.
On the contrary, a slide below the moving averages suggests the BTC/USDT pair may consolidate between $111,980 and $98,200 for a while longer.
Ether price prediction
Ether (ETH) turned up from the $2,111 level on Sunday and reached the 20-day EMA ($2.473) on Tuesday.
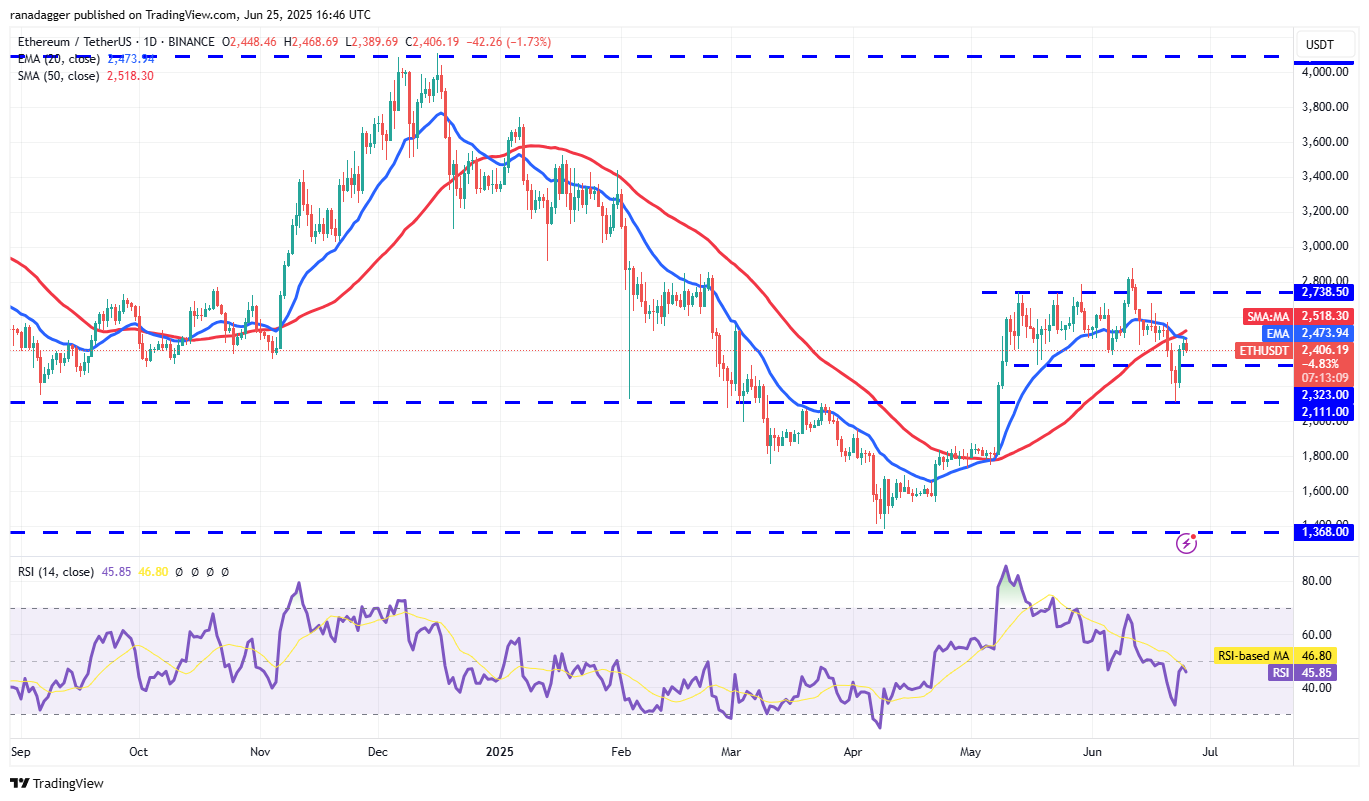
The 20-day EMA is flattening out, and the RSI is just below the midpoint, suggesting a balance between supply and demand. If the price rises above the moving averages, the ETH/USDT pair could rally to $2,738 and then to $2,879.
Contrary to this assumption, if the price turns down from the 20-day EMA and breaks below $2,323, it signals that bears are selling on rallies. The pair may then retest the solid support at $2,111.
XRP price prediction
XRP’s (XRP) sharp bounce off the $2 support on Monday indicates that the bulls are vigorously defending the level.
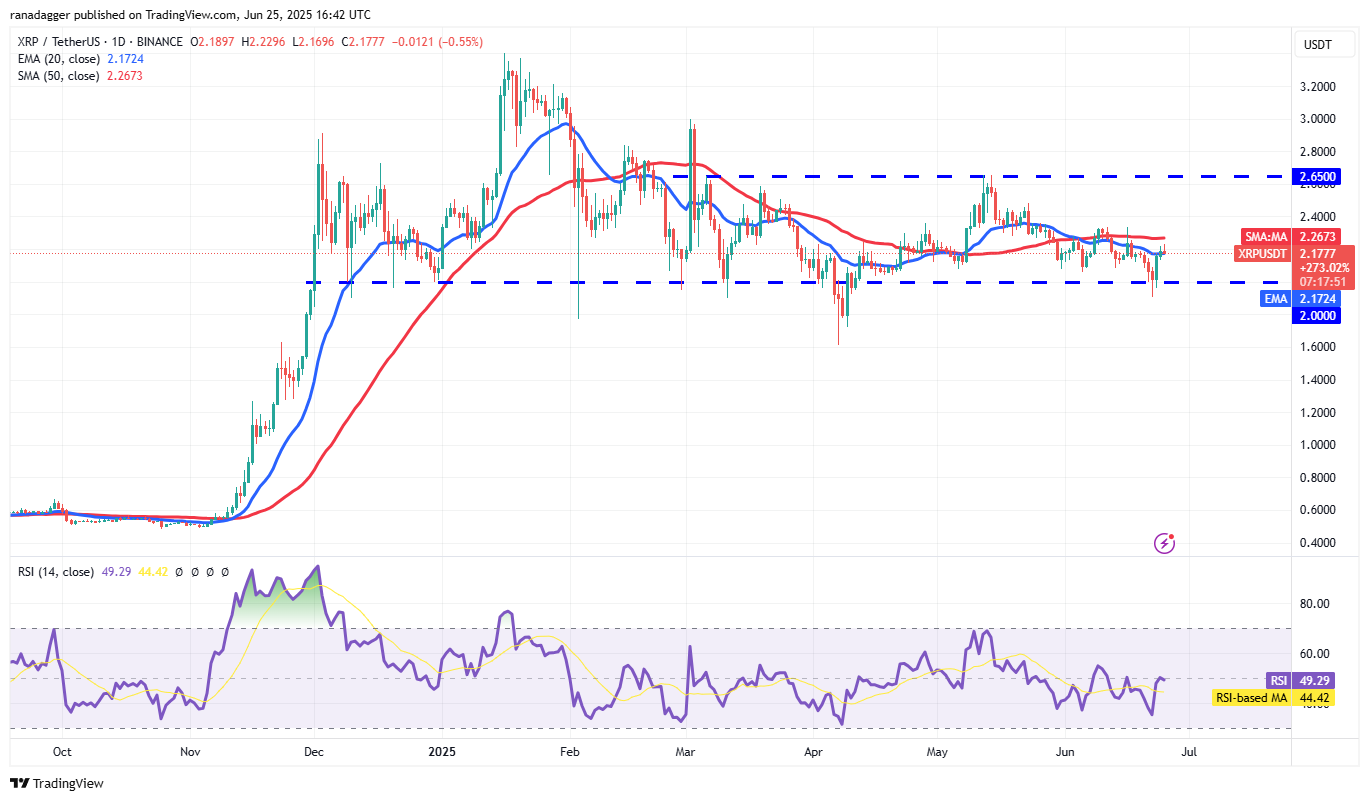
Both moving averages have flattened out, and the RSI is near the midpoint, signaling that the range-bound action between $2 and $2.65 may continue for a few more days.
The next trending move is likely to begin if buyers drive the price above $2.65 or sellers pull the XRP/USDT pair below $2. If the $2 support breaks down, the pair could decline to the $1.61 level. On the upside, a break above $2.65 clears the path for a rally to $3 and then to $3.40.
BNB price prediction
BNB (BNB) turned up from the support line of the descending channel pattern on Sunday and reached the resistance line on Wednesday.
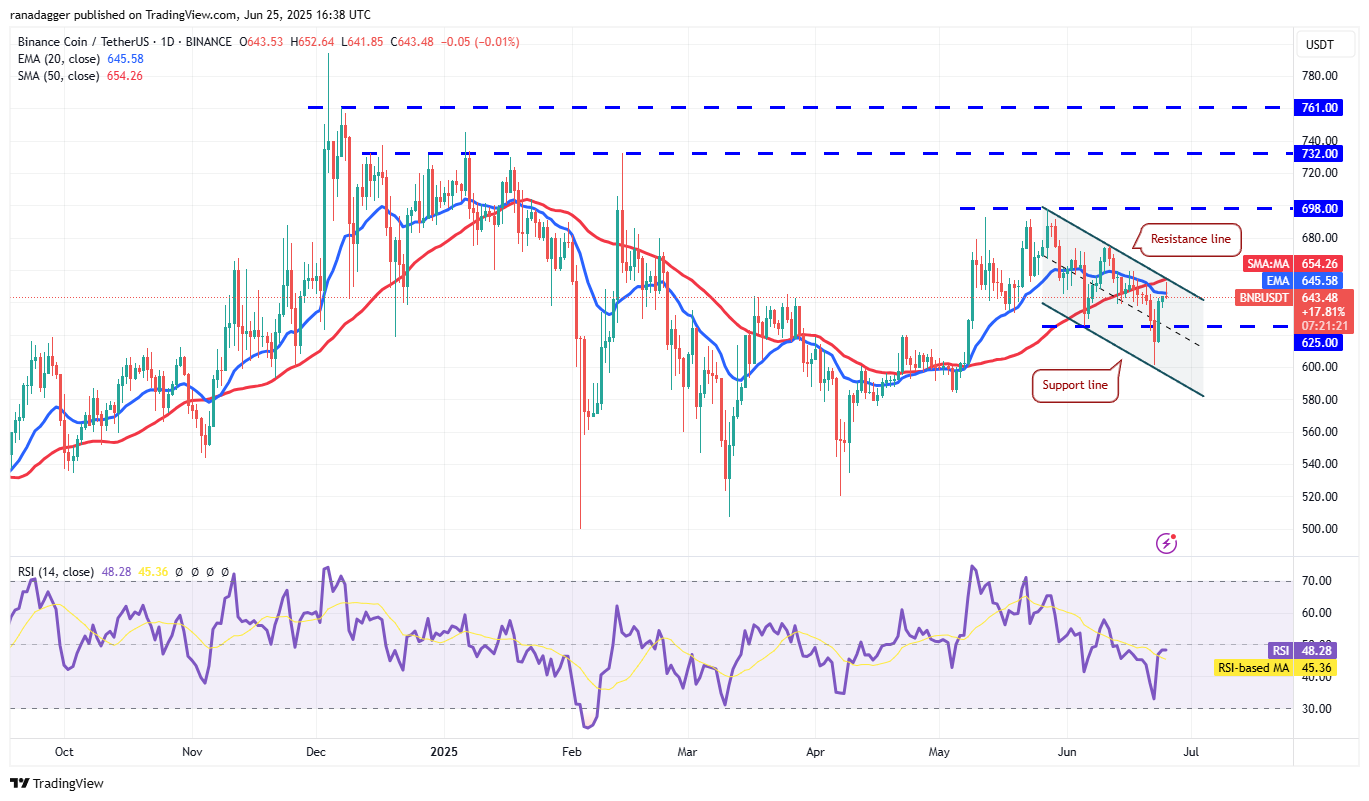
If buyers do not give up much ground from the resistance line, the prospects of a break above the channel improve. The BNB/USDT pair could ascend to $675 and, after that, to $698.
Contrarily, a break below $625 suggests that the bears are aggressively defending the resistance line. The pair may then tumble to the support line near $580, extending the stay inside the channel for a few more days.
Solana price prediction
Solana (SOL) turned up from $126 on Sunday and broke above the breakdown level of $140 on Monday.
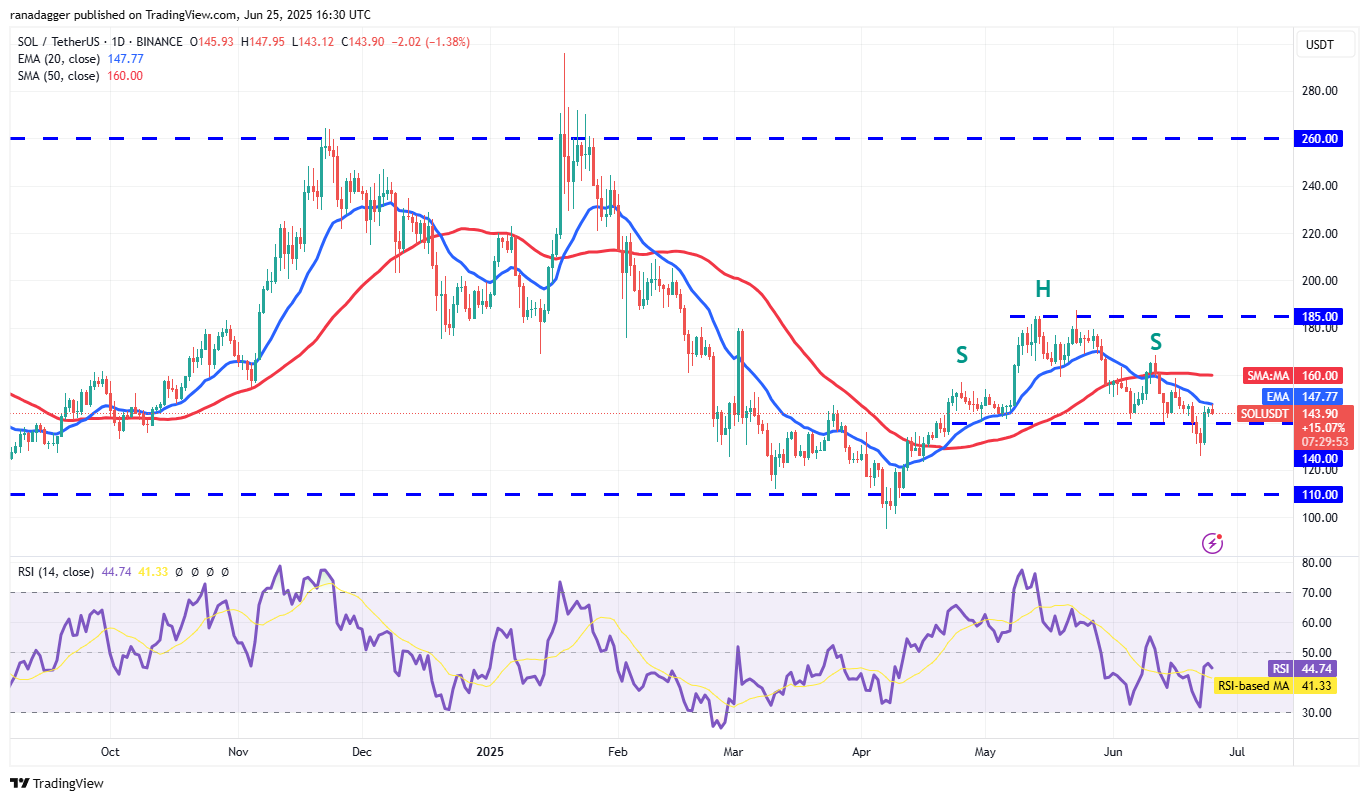
The recovery is facing selling at the 20-day EMA ($147), but a positive sign is that the bulls have not allowed the price to slide below $140. A shallow pullback increases the possibility of a break above the 20-day EMA. If that happens, the SOL/USDT pair could climb to the 50-day SMA ($160).
Sellers will have to pull and sustain the price below the $140 support to prevent the upside. The pair could then drop to $123 and eventually to $110.
Dogecoin price prediction
Dogecoin (DOGE) rebounded off the $0.14 support on Sunday, but the relief rally may face selling at the 20-day EMA ($0.17).
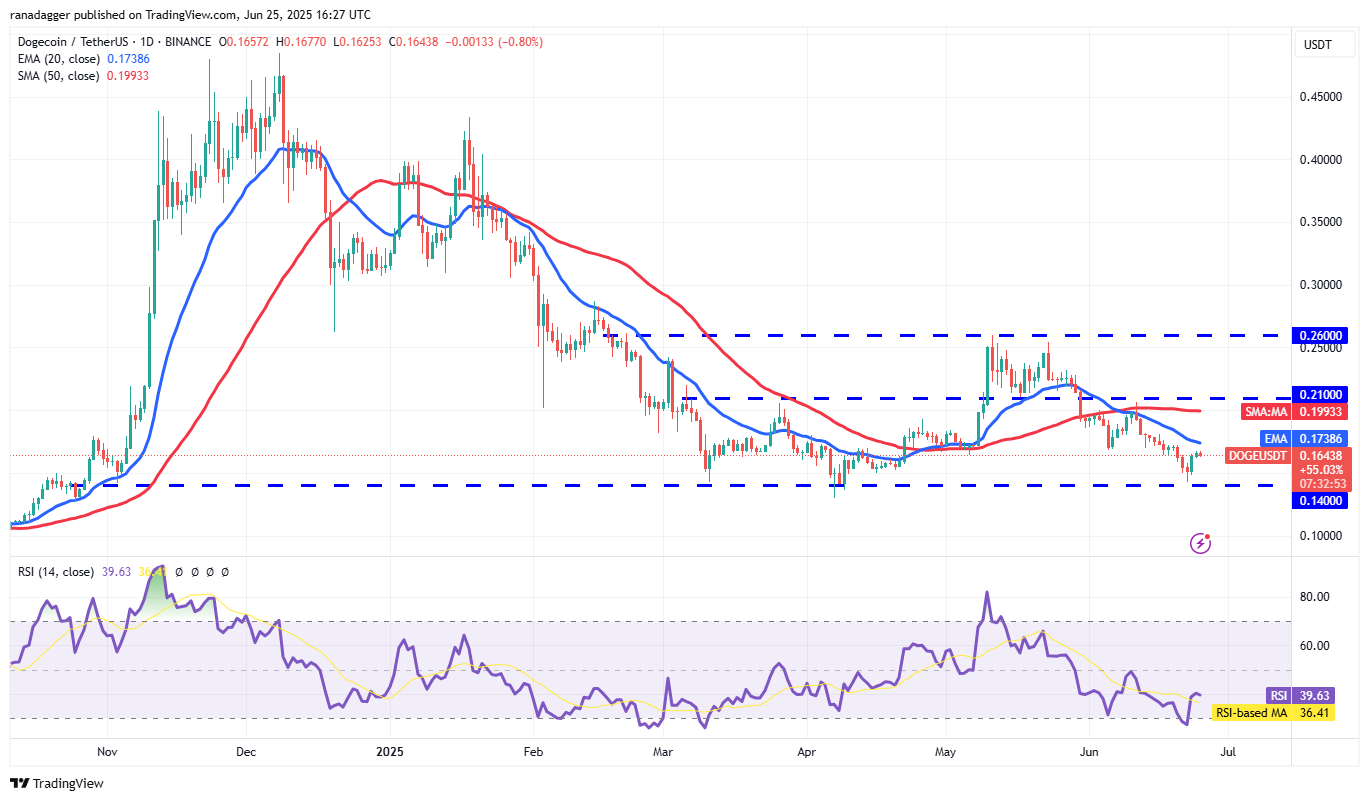
If the price turns down sharply from the 20-day EMA, the bears will make one more attempt to pull the DOGE/USDT pair below $0.14. If they manage to do that, the pair could tumble to the solid support at $0.10.
Alternatively, if buyers push the price above the 20-day EMA, the next stop could be the 50-day SMA ($0.20). Sellers will try to halt the recovery at the 50-day SMA, keeping the pair inside the $0.14 to $0.21 range for some more time.
Cardano price prediction
Cardano (ADA) rebounded off the $0.50 support on Sunday, but the recovery is likely to face selling at the moving averages.
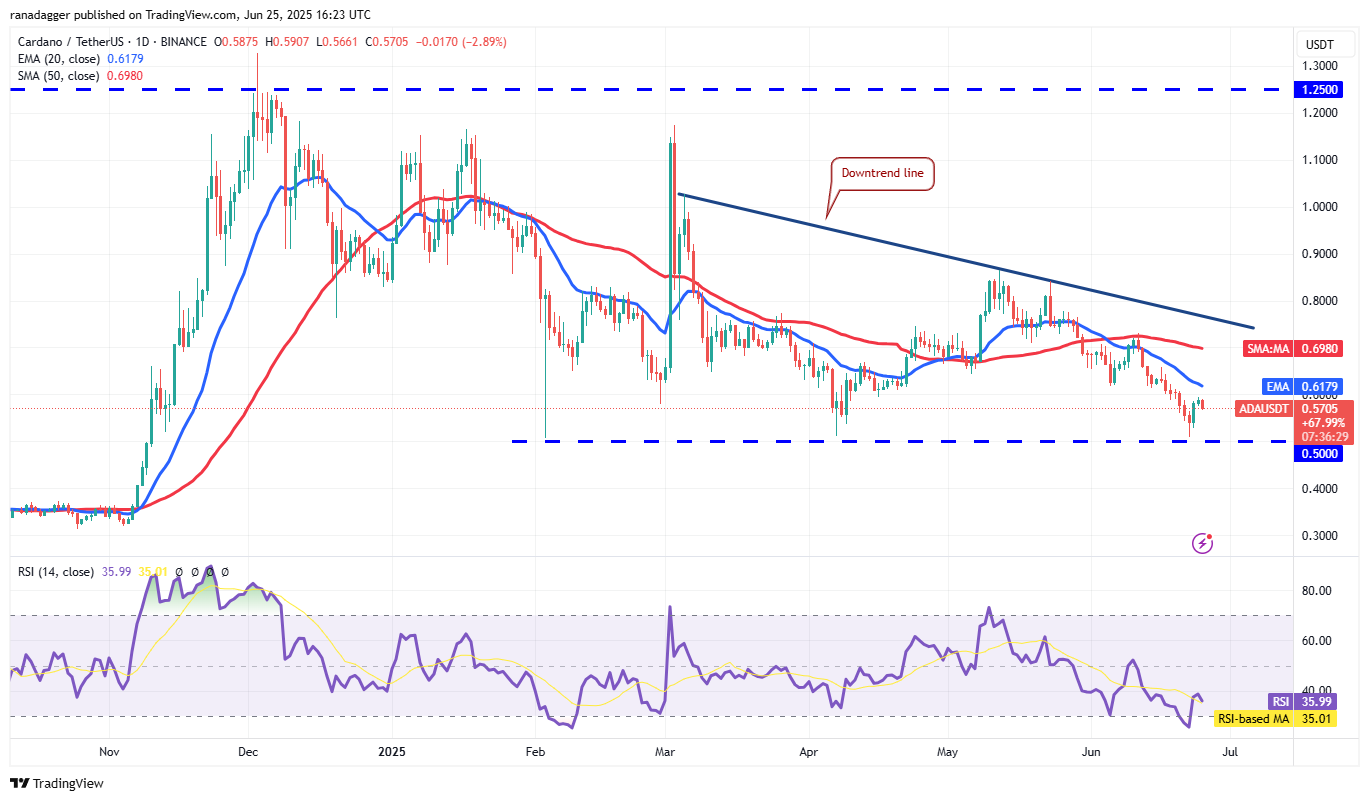
If the price turns down from the 20-day EMA ($0.61), it suggests that the bears are selling on every minor rally. That increases the risk of a break below the $0.50 support. If that happens, the ADA/USDT pair could slump to $0.40.
Instead, if buyers pierce the 20-day EMA, the pair could reach the 50-day SMA ($0.69). Sellers are expected to defend the zone between the 50-day SMA and the downtrend line, but if the bulls prevail, the pair will signal a potential trend change.
Related: Ethereum ‘death cross’ flashes for the first time since 2022 ETH price crash
Hyperliquid price prediction
Hyperliquid (HYPE) rebounded off the 50-day SMA ($33.37) on Monday and rose above the 20-day EMA ($37.13).
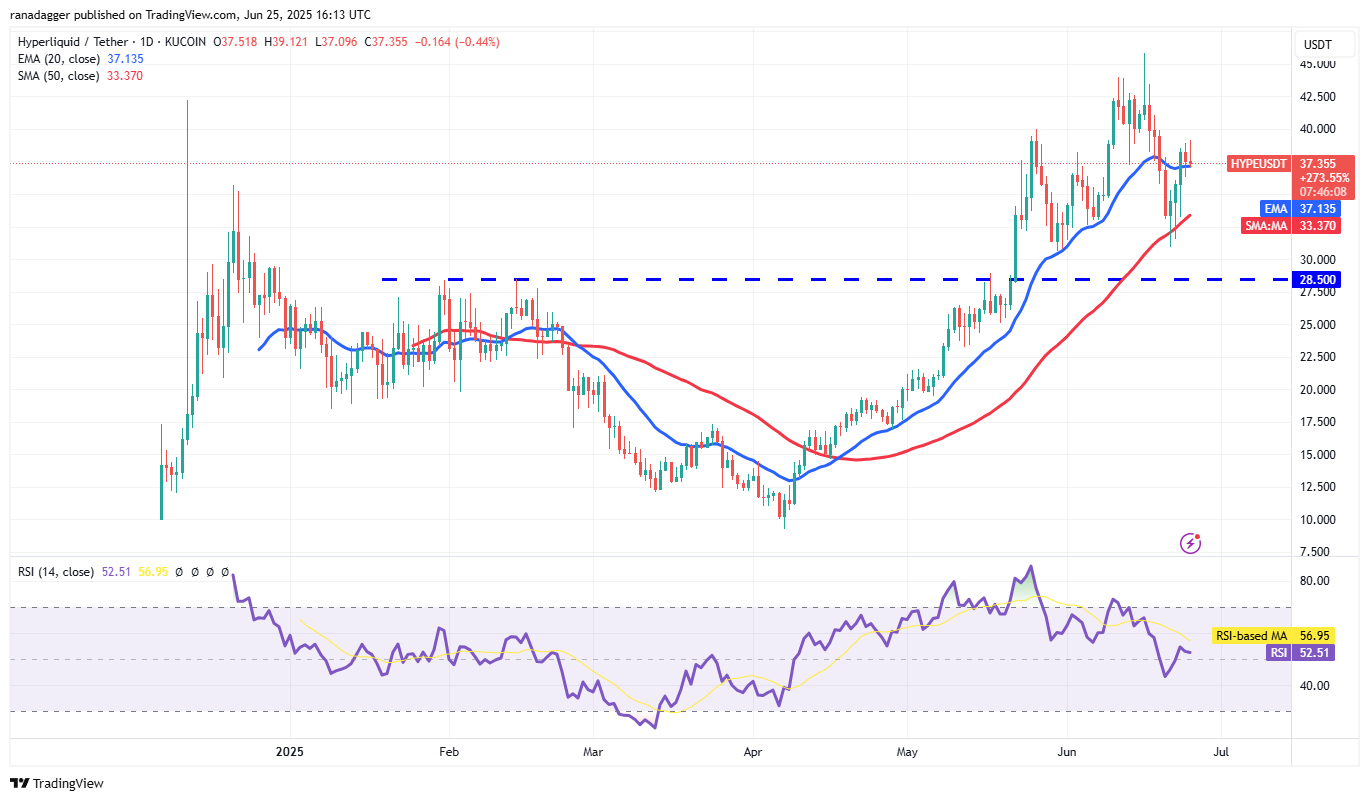
If buyers maintain the price above the 20-day EMA, the HYPE/USDT pair could surge to $42.50. Buyers may find it difficult to push the price above the $42.50 to $45.80 resistance zone.
On the downside, a break below the 20-day EMA signals a lack of buyers at higher levels. That opens the doors for a fall to the 50-day SMA and later to the crucial support at $30.50.
Bitcoin Cash price prediction
Bitcoin Cash (BCH) turned up from the 20-day EMA ($450) on Wednesday, indicating that lower levels continue to attract buyers.
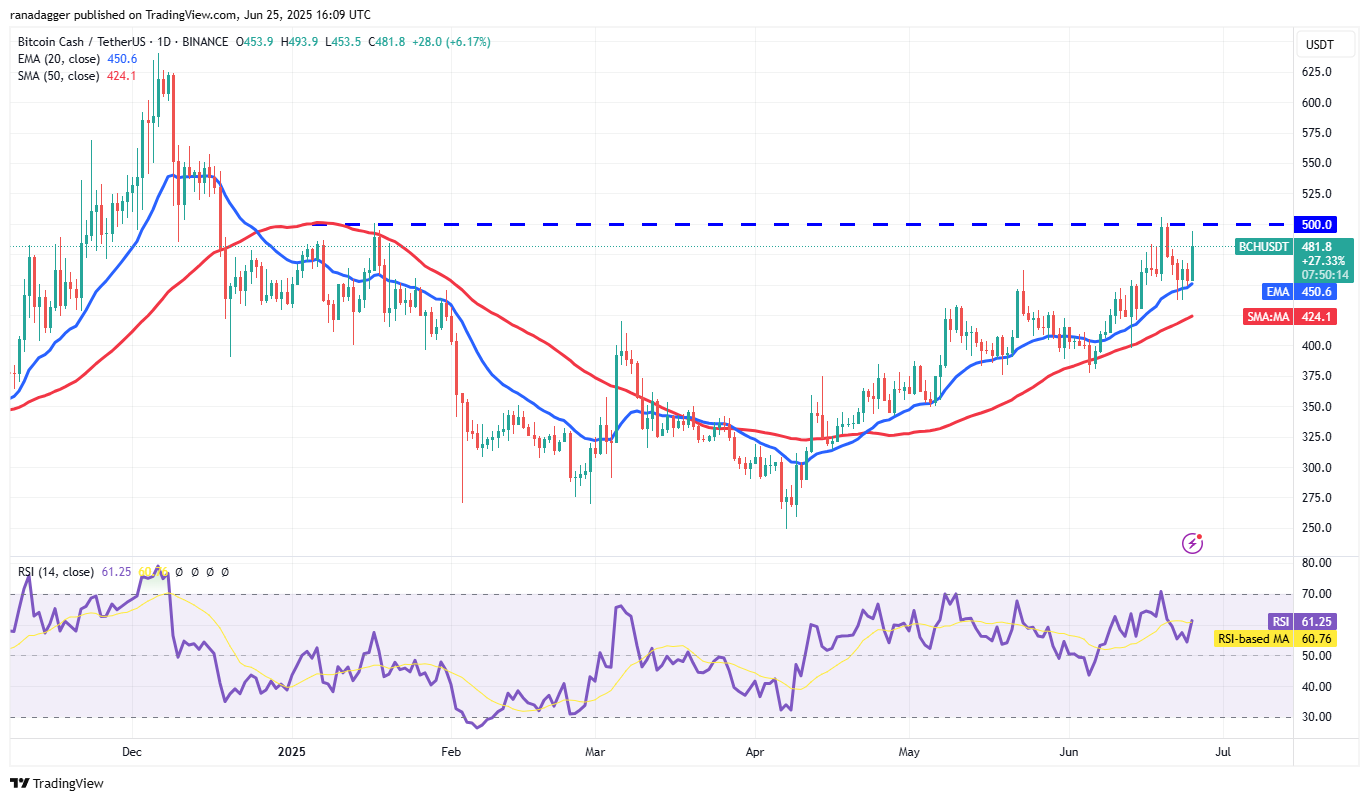
The price has reached the overhead resistance of $500, where the bears are expected to mount a strong defense. However, if buyers do not cede much ground to the bears, it increases the likelihood of a break above $500. If that happens, the BCH/USDT pair could surge to $550.
This positive view will be invalidated in the near term if the price turns down and breaks below the 50-day SMA ($424). The pair may then plunge to $375.
Sui price prediction
Sui (SUI) turned up sharply on Monday and reached the 20-day EMA ($2.94) on Tuesday, where the bears are posing a stiff challenge.
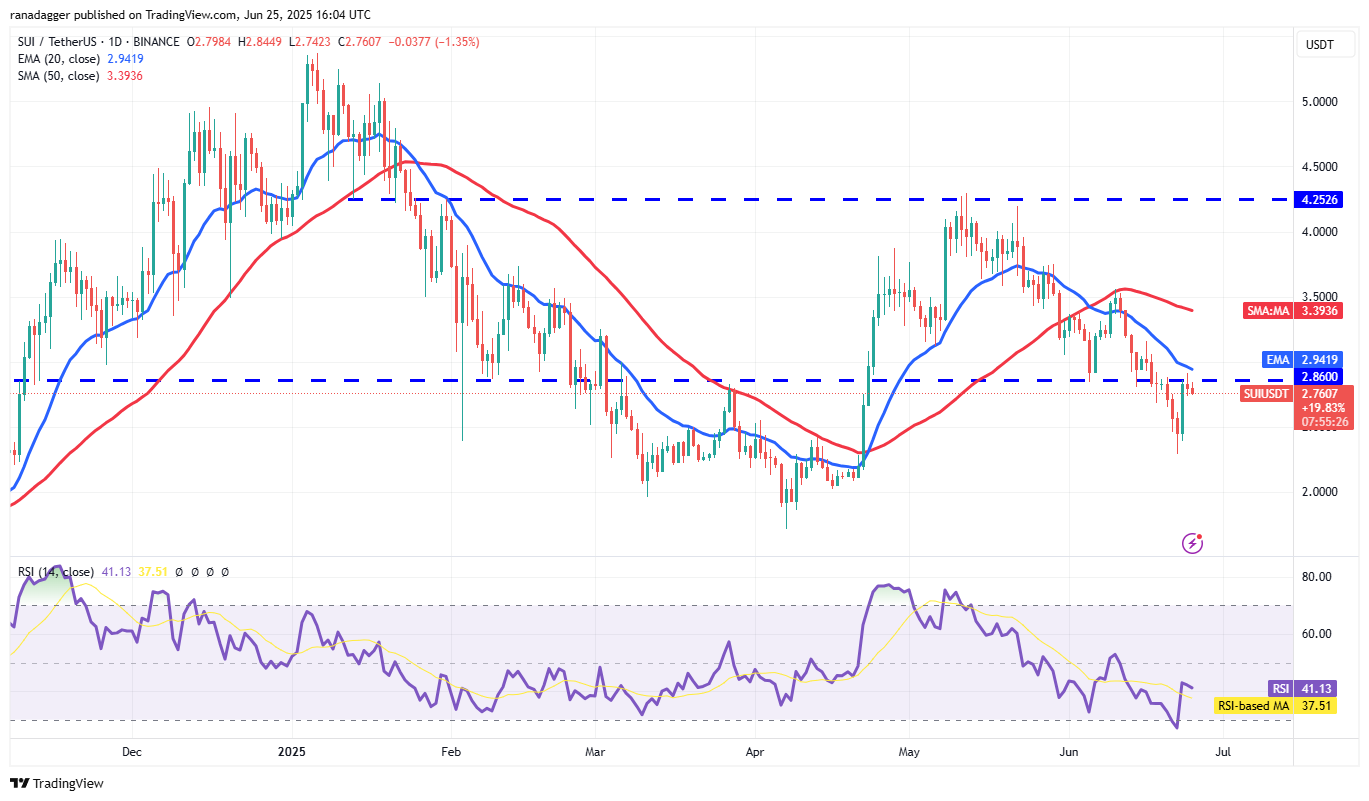
The downsloping 20-day EMA and the RSI in the negative territory signal that bears hold the edge. Sellers will try to pull the price toward the $2.29 to $2 support zone, but the buyers are likely to have other plans.
The bulls will try to arrest the decline and push the price above the 20-day EMA. If they manage to do that, the SUI/USDT pair could climb to the 50-day SMA ($3.39). Such a move suggests the correction may be over.
This article does not contain investment advice or recommendations. Every investment and trading move involves risk, and readers should conduct their own research when making a decision.


