

Key points:
-
Bitcoin still trades in its 18-day range despite a breakdown below $116,000.
-
The latency between pro-crypto policy from US regulators and the Trump administration and Bitcoin price has left traders feeling anxious.
Bitcoin (BTC) sold off sharply on Wednesday following the Federal Reserve’s release of the FOMC minutes and Fed Chair Jerome Powell’s presser, where he explained why the central bank elected not to cut interest rates. Prices rebounded on Thursday after US equities and crypto markets returned their focus to the fundamentals at hand and the projected longer-term impact of President Trump’s economic mandate.
Despite the sharp drop below $116,000, BTC continues to trade in the $115,000 to $121,000 range it has been in for the last 18 days, and data suggest a range expansion is imminent.
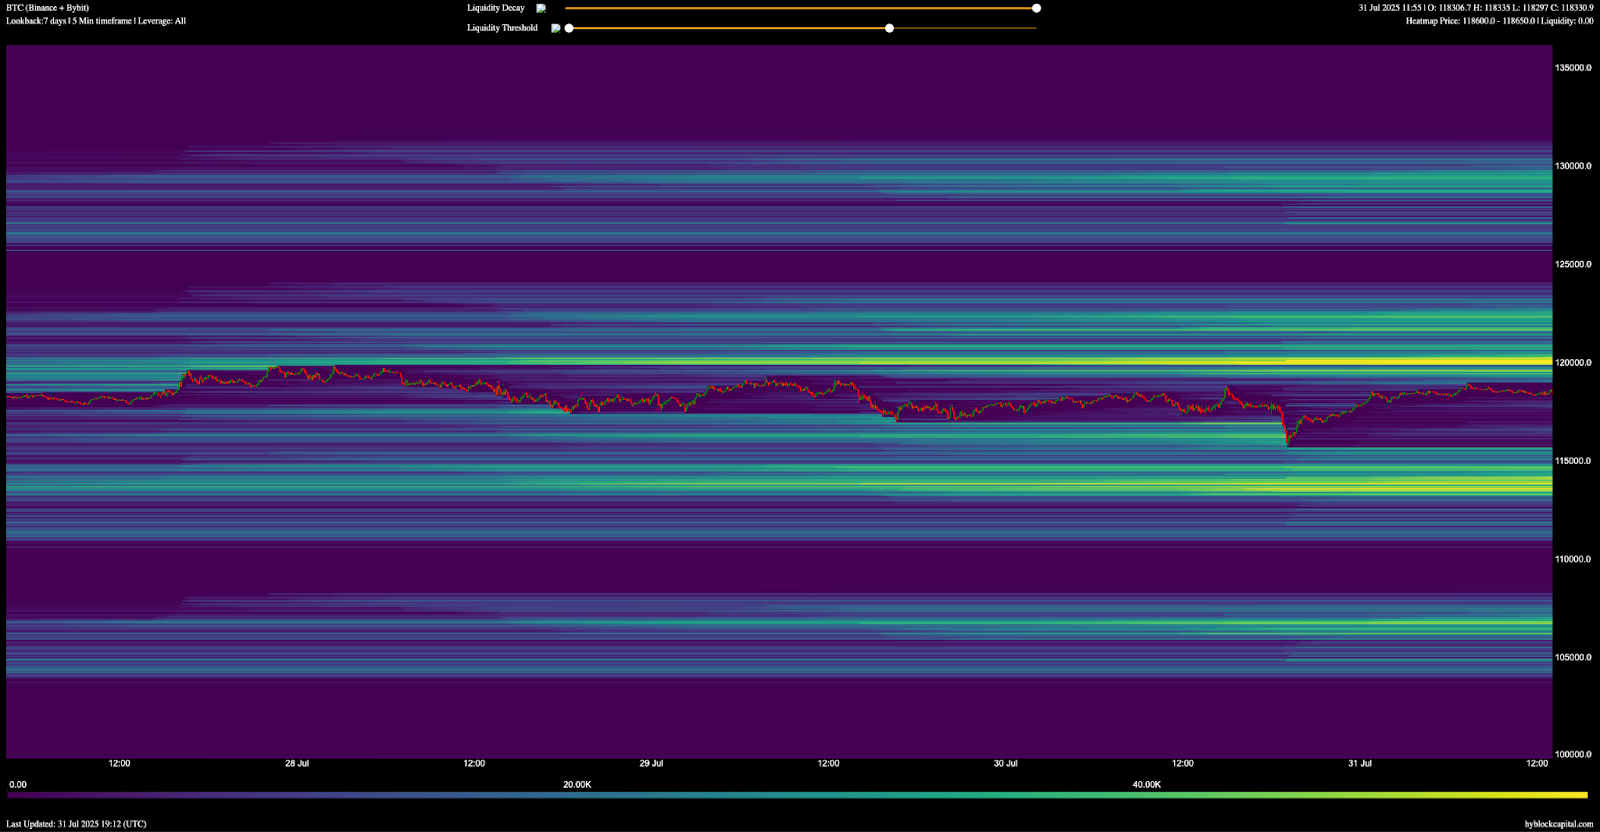
Analysts at Hyblock Capital described the pre- and post-FOMC price action as a liquidity hunt where “a classic indecision 15m candle emerged with wicks on both sides as markets wavered.” The analysts pointed to the bid-ask-ratio metric at 10% orderbook depth turning red, which heightened the chance of price tapping a liquidation level at $115,883.
Looking at the current liquidation heat map for the BTC/USDT perps pair at Binance and Bybit, the liquidation and price range remains unchanged, with short liquidations accelerating above $120,000 and longs at risk of liquidation below $115,000.
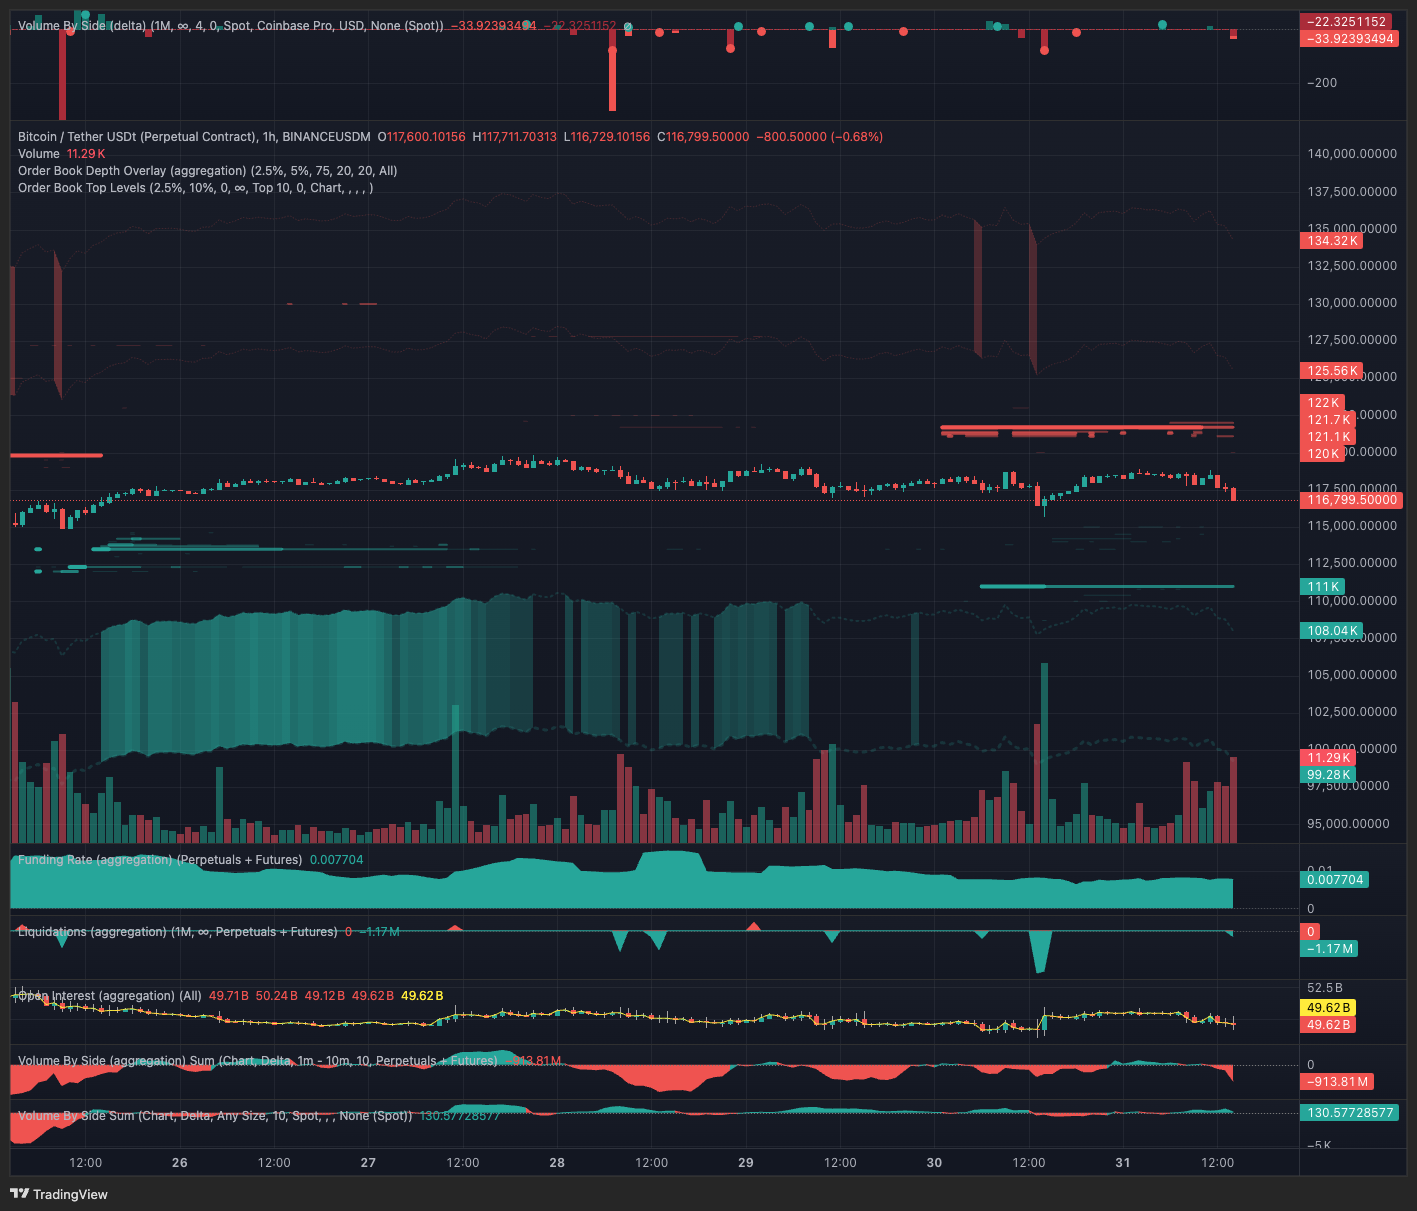
Aggregate orderbook (2.5% to 10% depth) data from TRDR shows sell walls thickening at $121,100 and substantial bids appearing at $111,000.
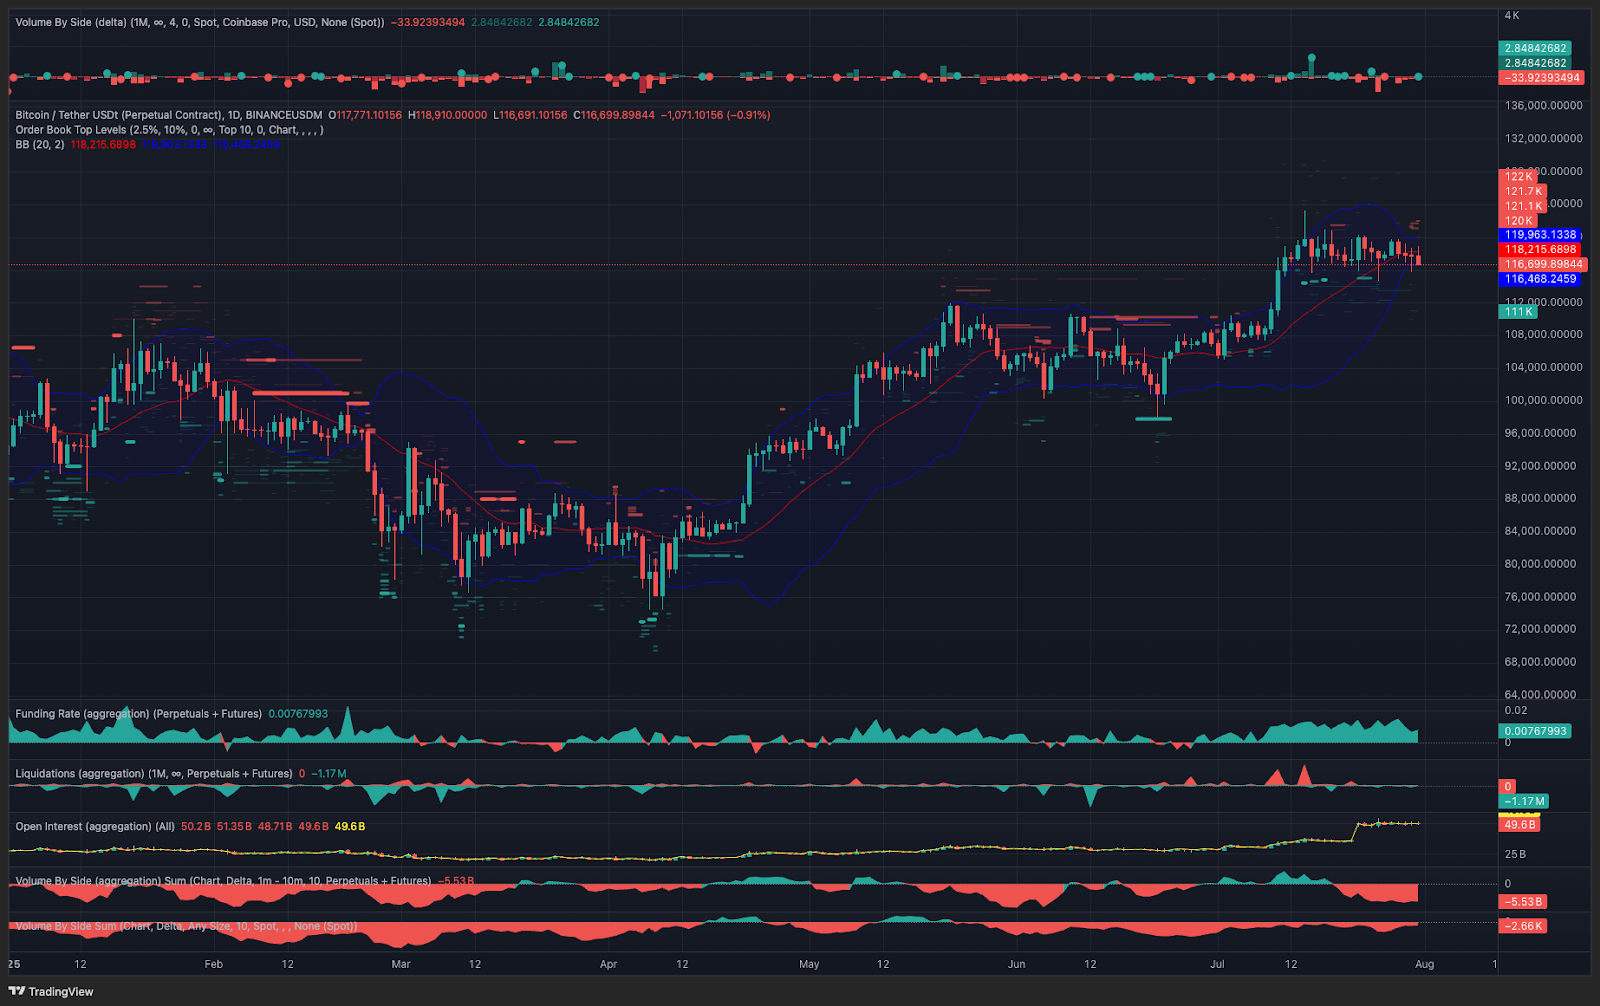
Price compression led to downside range expansion
On Wednesday, Cryptox analysts suggested that Bitcoin’s price compression and absence of aggressive leverage use in its futures markets are signs that BTC is on the verge of a range expansion. At the time, the Bollinger Bands had also narrowed, with BTC price trading above the 20-day moving average, leading many traders to predict an upside breakout.
Although the market has chosen to target Bitcoin’s downside liquidity, several positive actions remain at play. Capriole Investments founder Charles Edwards said that Bitcoin treasury buyers per day have taken off over the past six weeks, “with more than three companies buying Bitcoin every single day.” Edwards also noted that his ‘treasury buys and sells’ metric shows that “there’s currently 100:1 buyers versus sellers per month.”
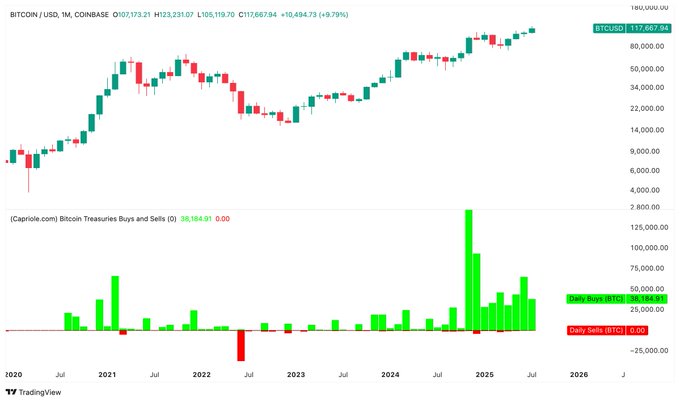
Related: Bitcoin price retargets $119K as treasuries buy 28K BTC in two days
Inflows to the spot Bitcoin ETFs have also resumed after witnessing $285 million in outflows last week. Data from SoSoValue shows that since July 23, the ETFs have seen $641.3 million total netflows, despite Bitcoin’s price selling off.
This week’s White House crypto report and Thursday’s American Leadership in the Digital Finance Revolution speech by SEC chairman Paul S. Atkins also set a precedent by laying out a clear set of policy objectives for how the Trump administration and regulators intend to prioritize the growth of the cryptocurrency sector in the US.
While their immediate impact may not be reflected by crypto prices, they do set the foundation for broader adoption and give institutional investors the signal to confidently increase their allocations to Bitcoin and other cryptocurrencies.

In the short term, if Bitcoin sellers continue to dominate the market, a price drop to absorb long liquidity in the $115,000 to $111,000 range seems likely. For the bulls, the most desired outcome would be a strong bid at $111,000, generating a high volume spike to reclaim the range above $116,000. An even better outcome would involve the spot and perpetual futures CVD turning positive as buyers make a push in both markets to secure a daily close above the $120,000 resistance.
This article is for general information purposes and is not intended to be and should not be taken as legal or investment advice. The views, thoughts, and opinions expressed here are the author’s alone and do not necessarily reflect or represent the views and opinions of Cryptox.


