Data shows the Bitcoin trading volume has declined by 38% since the highs in September as a result of the boring price action in the crypto.
Bitcoin Spot Trading Volume Has Plunged Down In Recent Days
As per the latest weekly report from Arcane Research, the current 7-day average BTC spot volumes are down to just around $7.9 billion.
The “daily trading volume” is an indicator that measures the total amount of Bitcoin being transacted in the spot markets on any given day.
When the value of this metric is high, it means the market is active right now as investors are moving around a large number of coins on spot exchanges.
On the other hand, low volumes suggest the BTC spot market is inactive at the moment. Such values of the indicator, when persisting, can imply that the general interest around the crypto among traders is low currently.
Now, here is a chart that shows the trend in the 7-day average daily Bitcoin trading volumes over the past year:
The 7-day average value of the metric seems to have been going down in recent days | Source: Arcane Research's The Weekly Update - Week 40, 2022
As you can see in the above graph, the Bitcoin spot trading volume just recently witnessed a spell of high activity that lasted for many weeks, ultimately culminating in the metric setting a new yearly high last month.
However, since this high in September, the indicator has been going downhill, and has now reached a value of just $7.9 billion.
At the peak, this value was around $12.8 billion, meaning that the trading volume has gone down about 38% in just the last couple of weeks or so.
The likely reason behind this plunge is the relatively stale price movement that Bitcoin as well as the wider crypto market have suffered from during the period.
The report notes that market participants would be waiting for the crypto to show a clear direction before they show any significant trading activity.
BTC Price
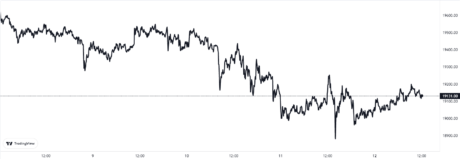
At the time of writing, Bitcoin’s price floats around $19.1k, down 5% in the last week. Over the past month, the crypto has lost 12% in value.
The below chart shows the trend in the price of the coin over the last five days.
Looks like the value of the crypto has continued to show mostly sideways movement in the last few days | Source: BTCUSD on TradingView
Bitcoin has been consolidating for several weeks now with the price trapped between the $19k and $20k levels, with only a couple of dips below the former mark. Currently, it’s unclear when this boring market might come to an end.
Featured image from Kanchanara on Unsplash.com, charts from TradingView.com, Arcane Research


