ATOM and DOT were trading in a sideways trend on Saturday, as crypto markets were mainly in consolidation mode to start the weekend. The majority of the cryptocurrency top 100 was marginally lower, as traders seemingly consolidated their gains from this week’s action.
Cosmos (ATOM)
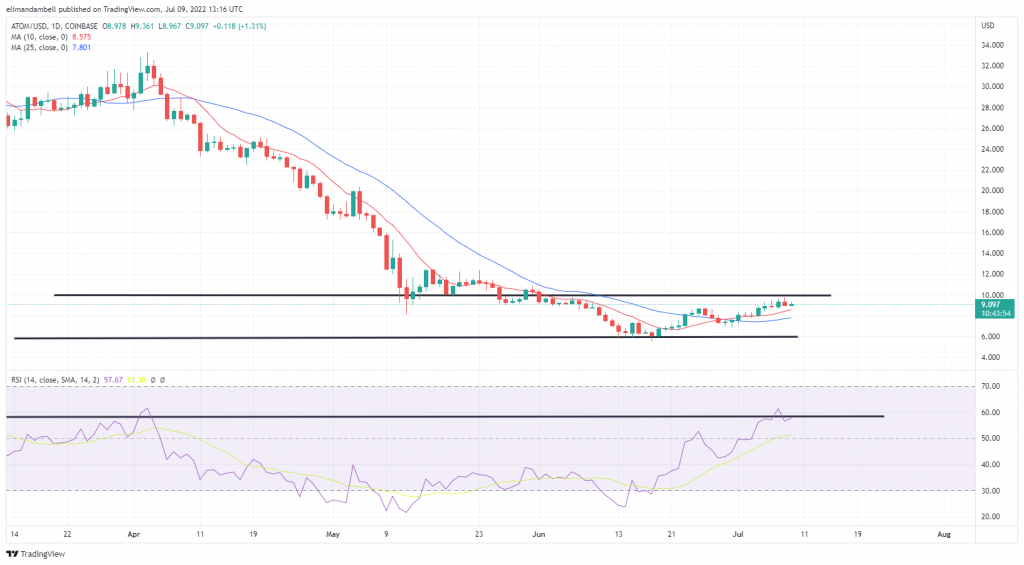
After almost ten consecutive sessions of higher highs, ATOM was consolidating to start the weekend, as traders seemingly secured gains.
The token rose to an intraday top of $9.34 to start the weekend, as bulls continue to move towards the $10 mark.
Saturday’s moves comes less than a day from prices trading at a low of $8.93, to now on the cusp of a potential breakout.

Over the last three weeks ATOM/USD has almost doubled in value, climbing from a floor of $5.48 on June 18, to its current point today.
This rally came following a crossover of the 10-day and 25-day moving averages (MA), respectively, which enticed traders to take long positions.
However, with the RSI now running into a wall at its 58.38 point, some of this momentum may slow, with traders instead taking profits, rather than maintaining open positions.
Polkadot (DOT)
Following a slow start to the day, DOT shook off market uncertainty to marginally rise during today’s session.
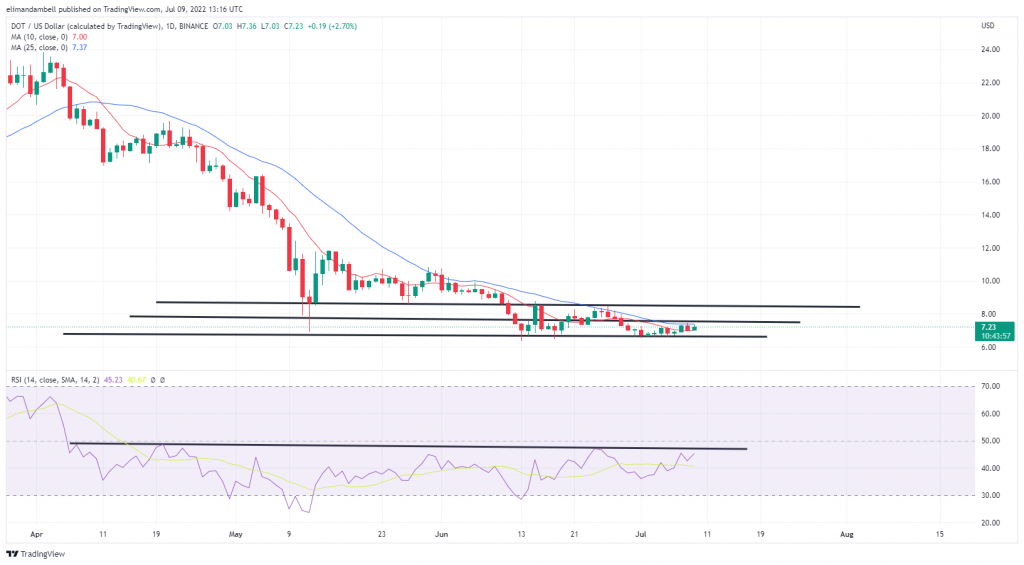
DOT/USD surged to a peak of $7.35 to start the weekend, which follows on from a low of $6.97 on Friday.
Today’s action now sees DOT moving closer to a ceiling of $7.50, a point it has not broken in the last ten days.

Whilst prices have consolidated below this ceiling since June 29, price strength also remains under a resistance point — one that has been in place for over three months.
The 14-day Relative Strength Index is currently tracking at 45.10, which is below the ceiling of 46.90, which hasn’t been broken since April 5.
Despite this, DOT has climbed by nearly 7% in the last week, leading the 10-day MA to near a possible cross with its 25-day counterpart.
Providing this occurs, not only could prices climb above $7.50, but we may see bulls target the $8.50 mark.
Could we see DOT climb to as high as $10 during the month of July? Let us know your thoughts in the comments.
Image Credits: Shutterstock, Pixabay, Wiki Commons
Disclaimer: This article is for informational purposes only. It is not a direct offer or solicitation of an offer to buy or sell, or a recommendation or endorsement of any products, services, or companies. Cryptox.trade does not provide investment, tax, legal, or accounting advice. Neither the company nor the author is responsible, directly or indirectly, for any damage or loss caused or alleged to be caused by or in connection with the use of or reliance on any content, goods or services mentioned in this article.


