An analyst has explained how a pattern forming in the Dogecoin price may suggest a rally to $1, if historical trend repeats this time as well.
Dogecoin 1-Week Price Appears To Be Forming A Classic Pattern
In a new post on X, analyst Ali has discussed how DOGE seems to have been showing a classic pattern in its weekly price once again. This trend involves a technical analysis (TA) pattern called the “Descending Triangle,” which, as its name suggests, is shaped like a triangle.
The pattern involves two trendlines between which the price of the asset consolidates; one of these is a line slopped downwards while the other is parallel to the time-axis. This property of the price converging downwards as it goes through the pattern is why it has descending in its name.
Like other TA consolidation patterns, the upper line of the Descending Triangle also provides resistance to the commodity, making tops more probable to form at it. Similarly, the lower line acts as a point of support and can help the price reverse back upwards.
A break out of either of these lines may result in a continuation of the trend in that direction. This means that a break above the triangle can be a bullish signal, while one below could suggest the dominance of bearish momentum.
Similar to the Descending Triangle, there is also an Ascending Triangle in TA, which works much like it, except for the fact that the parallel axis makes the upper line, connecting together tops, while the lower line ascends up as it joins higher lows.
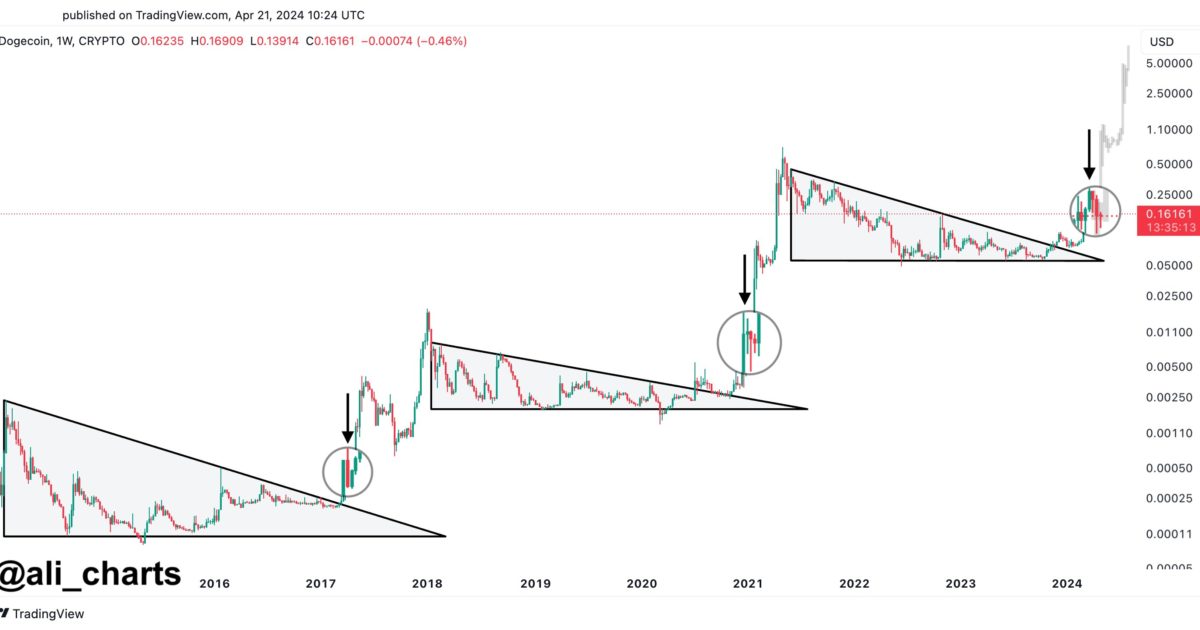
Now, here is the chart shared by Ali that highlights a pattern that DOGE’s 7-day price has been forming recently:
The classic pattern that DOGE seems to have formed before in its history | Source: @ali_charts on X
From the graph, it’s visible that the Dogecoin 1-week price had been trading inside a long Descending Triangle between 2021 and this year, but the meme coin found a break earlier and has since registered some notable uplift.
Recently, though, the cryptocurrency has reached a stage of sideways movement. This, however, may not entirely be a bad thing, as DOGE has also seen a similar trend of a Descending Triangle break followed by consolidation in the past as well.
As is visible in the chart, the previous two such formations led to Dogecoin witnessing some very significant growth. As such, the latest one may also prove to be bullish, if this historical pattern continues to hold.
“Based on past trends, we might just see DOGE rocket towards $1 in the coming weeks!” explains Ali. From the current spot price, such a potential rally would mean a growth of a whopping 525% for the coin.
DOGE Price
Dogecoin’s price action has been quite stale since the price plunge earlier in the month, as the asset’s price is still trading around $0.16.
The price of the asset appears to have been moving sideways since the drawdown | Source: DOGEUSD on TradingView
Featured image from Kanchanara on Unsplash.com, charts from TradingView.com
Disclaimer: The article is provided for educational purposes only. It does not represent the opinions of NewsBTC on whether to buy, sell or hold any investments and naturally investing carries risks. You are advised to conduct your own research before making any investment decisions. Use information provided on this website entirely at your own risk.


