The Bitcoin STH-SOPR (EMA-30) has now returned above a value of one for the first time in four months, a sign that could prove to be bullish for the price of the crypto.
Bitcoin Short-Term Holder SOPR Has Broken Above 1 Recently
As pointed out by an analyst in a CryptoQuant post, the BTC STH-SOPR is currently forming a pattern that has historically been bullish for the coin.
The “Spent Output Profit Ratio” (or the SOPR in short) is a Bitcoin indicator that tells us whether coins in the market are selling at a profit or at a loss right now.
The metric works by looking at the history of each coin being sold and checking whether the price it last moved at was less than the current one or more than it.
When the value of this indicator is above one, it means investors are, on average, selling their Bitcoin at a profit right now.
Related Reading | Possible Timelines For Bitcoin To Hit $100k: Why CEOs See Bullish Signs
On the other hand, SOPR values below one imply overall losses are being realized in the BTC market at the moment.
A modified version of this indicator takes into account only those investors who held their coins for less than 155 days before selling them. This group of investors is called the short-term holders (STH).
Now, here is a chart that shows the trend in the Bitcoin STH-SOPR (EMA-30) over the last few years:
Looks like the value of the metric has risen above one recently | Source: CryptoQuant
As you can see in the above graph, the Bitcoin STH-SOPR (EMA-30) seems to have followed a pattern over the last five years.
It looks like during bearish periods, the indicator has always had a value less than one. While bullish trends have occurred while the metric has had a value greater than one.
Recently, the STH-SOPR has broken above 1 once again after staying below the threshold for nearly four months since December of 2021.
Related Reading | Data Shows Bitcoin Investors Afraid To Take Risk As Leverage Remains Low
If the pattern from before holds true now as well, then this breakout may suggest that Bitcoin will rally towards at least a local top soon.
However, such an uptrend may not last too long. In the chart, there are two regions where the metric did break above 1 and the price rallied some, before continuing the bearish trend and the STH-SOPR returned to loss values.
BTC Price
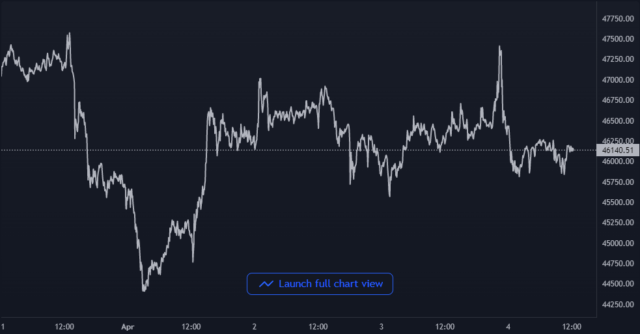
At the time of writing, Bitcoin’s price floats around $46.1k, down 2% in the past week. The below chart shows the recent trend in the value of the coin.
BTC's price seems to have moved sideways over the last few days | Source: BTCUSD on TradingView
Featured image from Unsplash.com, charts from TradingView.com, CryptoQuant.com


