

Key points:
-
Bitcoin reaches $111,000 for the first time in November, but traders anticipate the weekend’s upside unraveling.
-
Coinbase sell pressure comes as a Bitcoin whale resumes distributing BTC.
-
Bulls are still unable to reclaim lost support at $111,200 and above.
Bitcoin (BTC) saw a late bid into Sunday’s weekly close as key reclaim levels stayed out of reach.
Bitcoin traders distrust “Sunday pump”
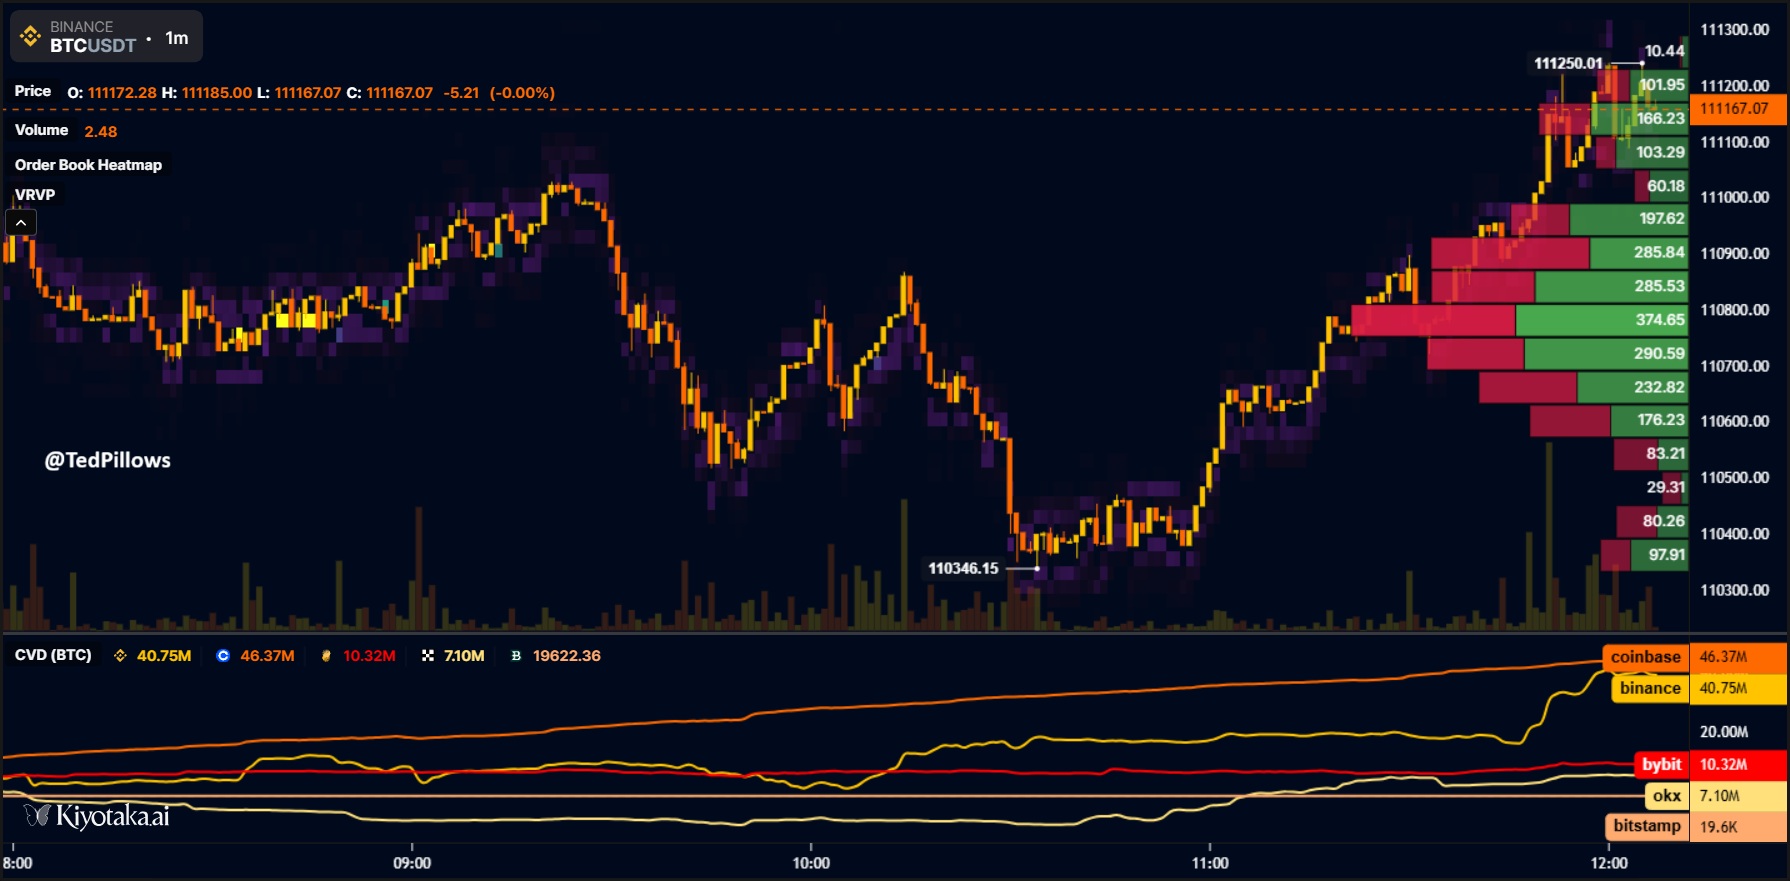
Data from Cointelegraph Markets Pro and TradingView tracked the BTC price action as it reached local highs of $111,129 on Bitstamp.
While still rangebound, that level marked a new November high amid the sudden return of bidder interest on major exchanges.
“Binance and Coinbase are bidding on $BTC now,” crypto investor and entrepreneur Ted Pillows confirmed on X.
Pillows noted that the trend contrasted with that seen during the week. As Cointelegraph reported, US sessions in particular were characterized by sell-side pressure.
A weekend move to the upside, he implied, would not hold after the return of TradFi markets.
“I would really appreciate that if they’ll bid on weekdays too. Another Sunday pump, and we know how this ends,” he added.
Commentator Exitpump forecast further Sunday gains topping out at $114,000 at most.
“If that’s going to happen, then due to nature of Sunday, price can easily tag 113k and 114k going into Monday, but have low conviction in this,” he wrote.

Not everyone was in the mood to buy. Trader BitBull observed renewed distribution from a Bitcoin whale wallet with outflows worth $650 million since BTC/USD crashed up to 20% from all-time highs in October.
The insider OG whale is selling more Bitcoin.
Today, he deposited another $55M in BTC to Kraken.
Since the October crash, the whale has sold over $650M in $BTC.
When will he stop dumping? pic.twitter.com/irzkWhQLzG
— BitBull (@AkaBull_) November 2, 2025
BTC price support remains out of reach
Turning to important support and resistance levels, trader and analyst Rekt Capital flagged Bitcoin’s 21-week exponential moving average (EMA) as a nearby trend line to reclaim.
Related: Bitcoin starts $100K ‘capitulation’ as BTC price metric sees big volatility
The 21-week EMA was at $111,230 at the time of writing, functioning as the current ceiling of the weekend’s upside.
“Bitcoin is not too far away from reclaiming the 21-week EMA (green) for a successful post-breakout retest,” Rekt Capital summarized Saturday.
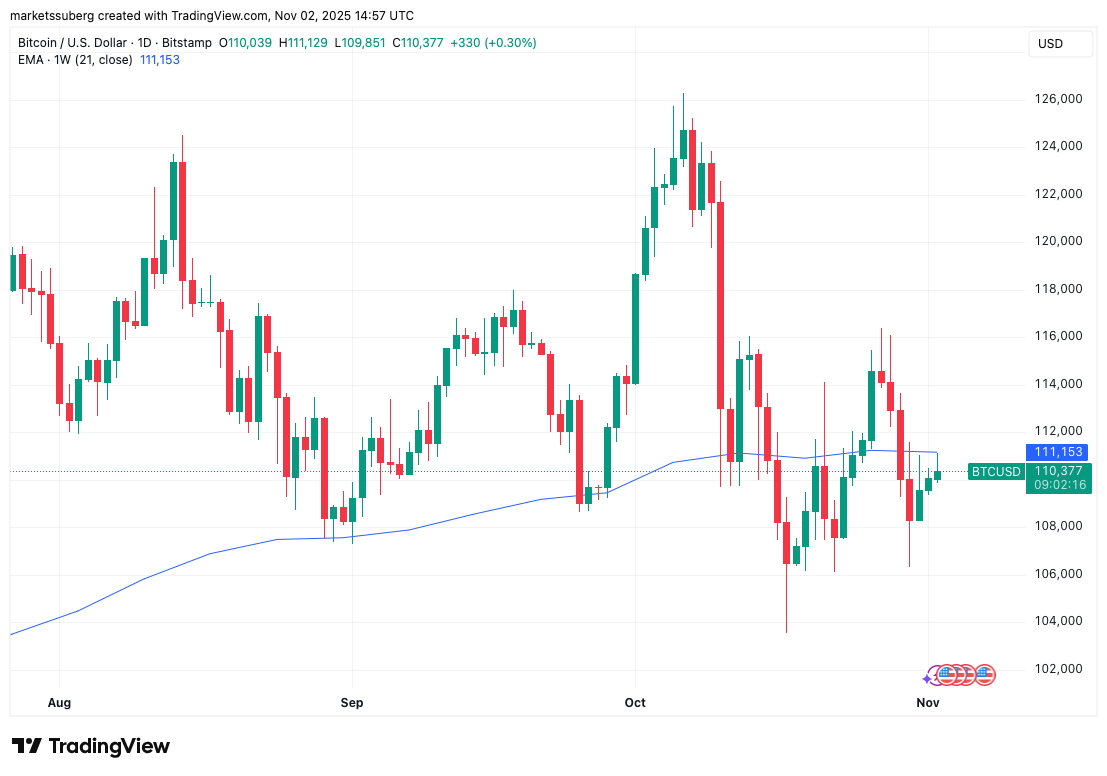
Pillows, meanwhile, saw the need for bulls to flip $112,000 back to support.
$BTC pumped a little on the US-China trade deal.
But the strength is still not there.
Bitcoin needs to reclaim $112,000 level with strong volume for more upside.
A failure to do that will result in a bigger correction. pic.twitter.com/WcyuNjyEkD
— Ted (@TedPillows) November 2, 2025
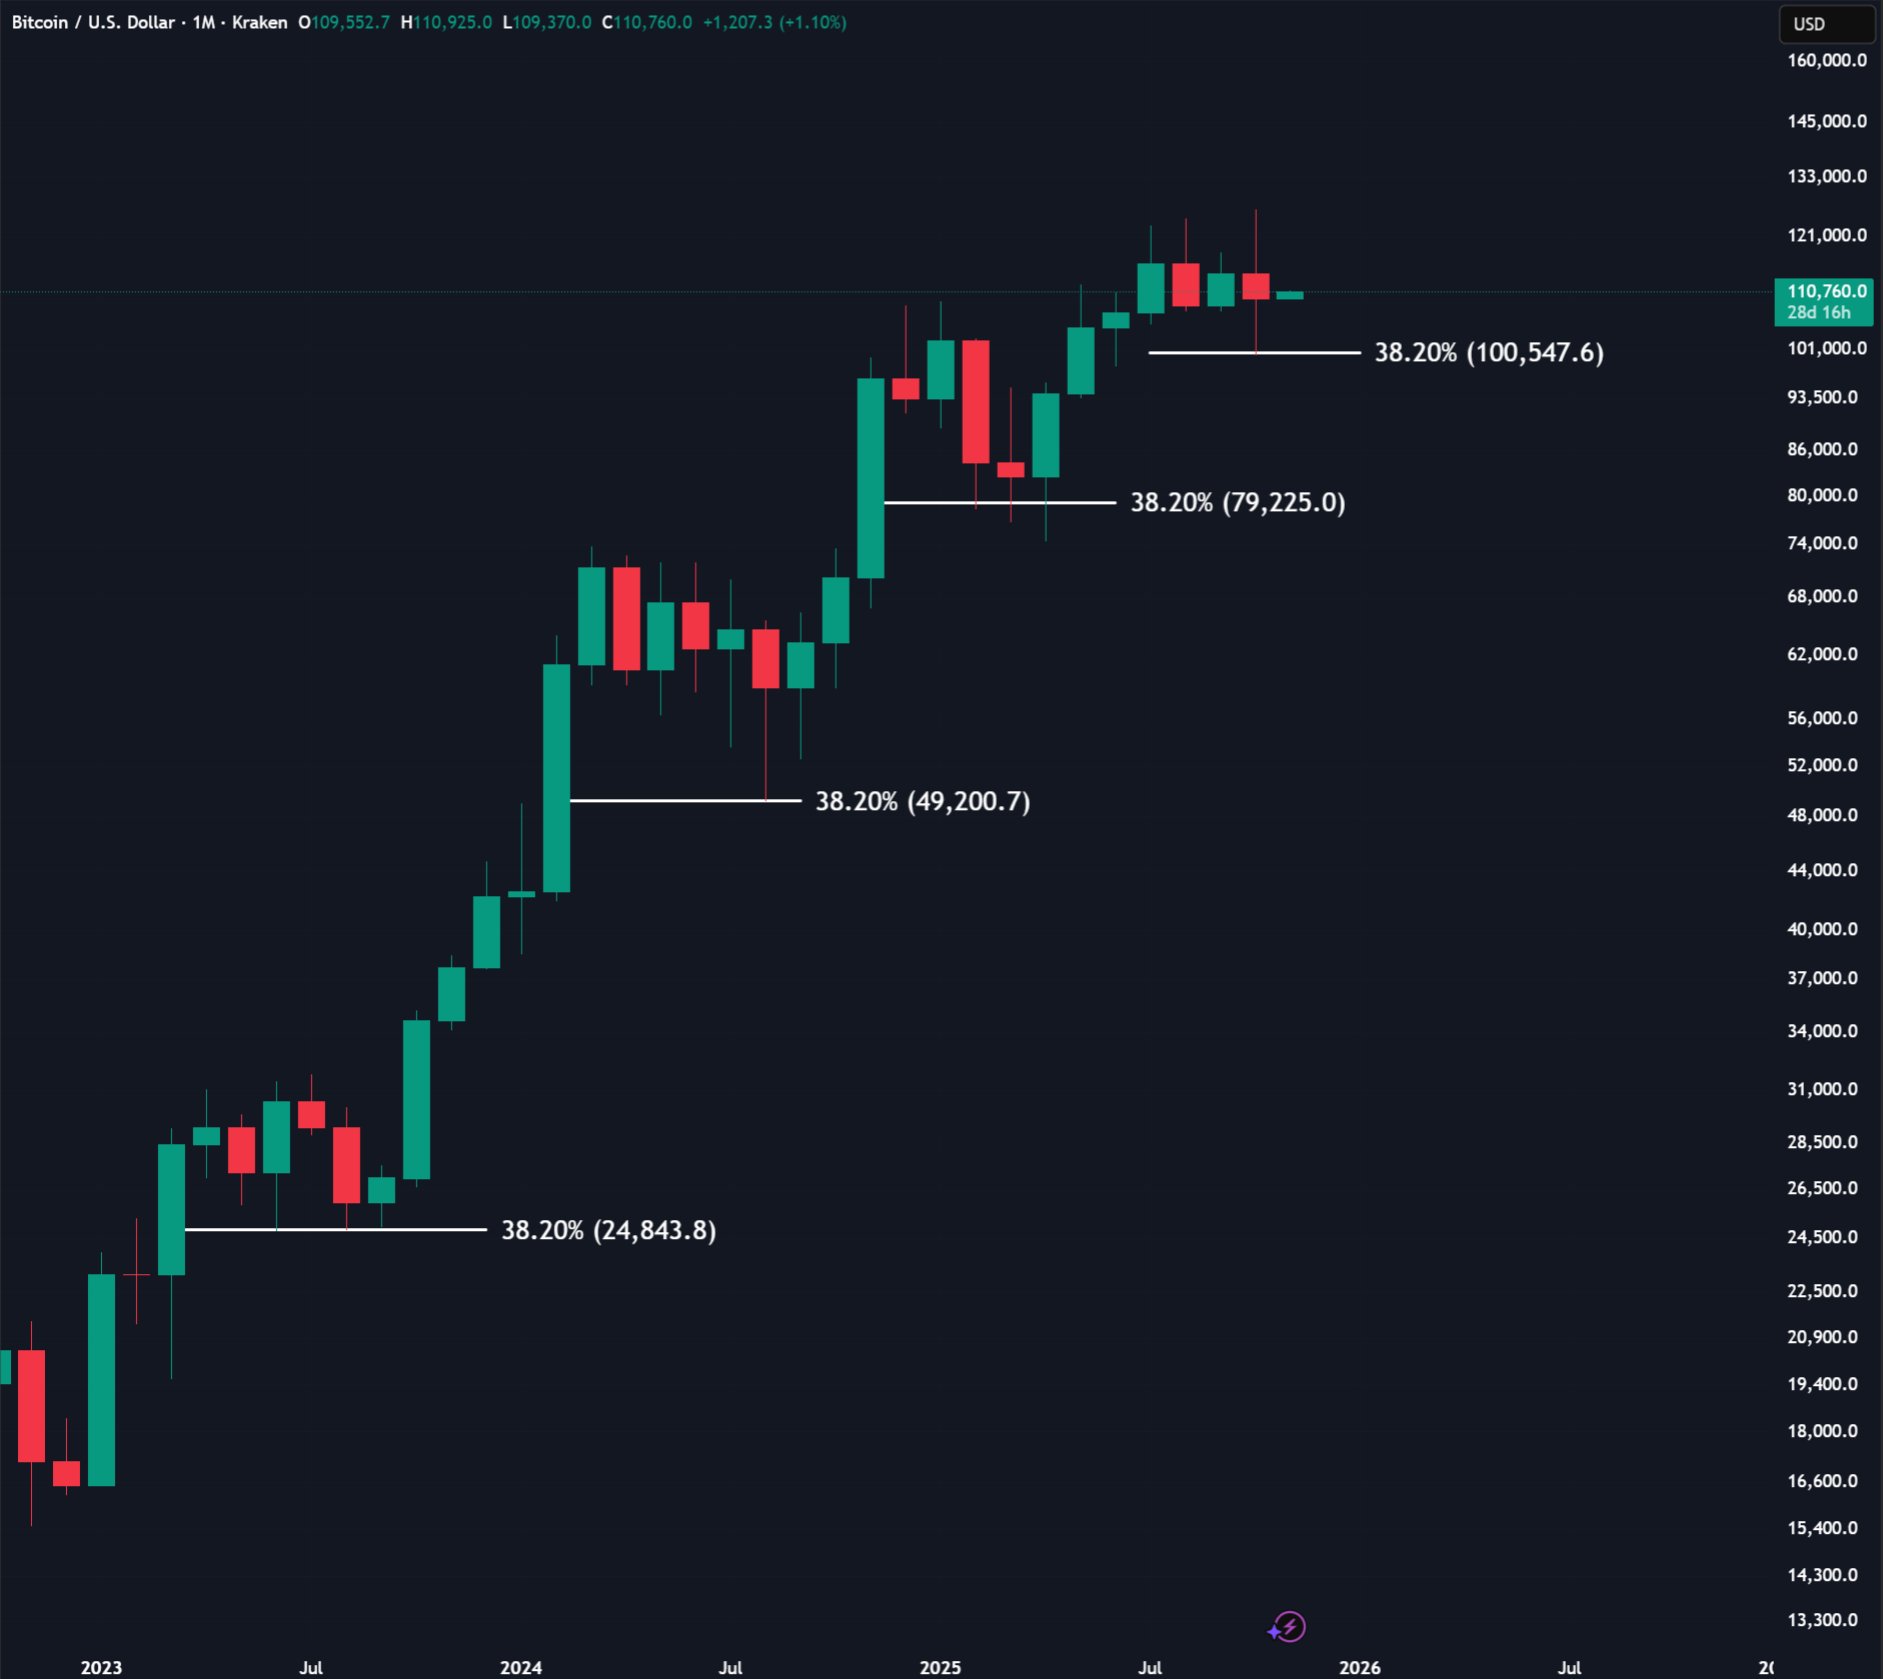
Cas Abbe, a contributor to the onchain analytics platform CryptoQuant, meanwhile, placed price action in the context of Fibonacci retracement levels.
“BTC usually bottoms around 38.2% Fibonacci level. This has been the case since Q1 2023, and last month something similar happened,” an X post on the topic stated.
“BTC dropped to this exact Fibonacci level, and then bounced back. If history is anything to go by, BTC has bottomed out. And if BTC closes a monthly candle below it, the bull run will be most likely over.”
The level in question was just above the $100,000 mark.
This article does not contain investment advice or recommendations. Every investment and trading move involves risk, and readers should conduct their own research when making a decision.


