

2020 has been a brutal year on all accounts, topped off by the most boring sideways action in Bitcoin yet.
In fact, this truly is the most stagnant range in the history of the first-ever cryptocurrency, according to a range-measuring technical indicator.
Bitcoin True Range Reaches Record-Setting Low
Bitcoin price is trading at roughly $9,200. It’s been trading within just a few percent from that price for the last few months.
Any attempts to push prices lower results in dip buyers stepping in and wicks left to the downside. All rallies to above $10,000 however are swatted down by bears back into the range.
Related Reading | Bitcoin Historical Volatility Approaching Zero Could Signal Blossoming Bull Trend
Nothing thus far has been able to break it, yet nearly every crypto analyst and trader is expecting an enormous move when the range does finally give.
An indicator measuring the True Range percentage of BTCUSD price action has now fallen to the lowest point in the asset’s just over decade long history.
Brave New Coin Bitcoin Liquid Index True Range % | Source: TradingView
Bitazu Capital founding partner Mohit Sorout shared the chart via Twitter highlighting the extreme reading on the indicator. Nearly every fall to this low of a measurement has resulted in a powerful movement afterward. And if Bitcoin price is at the lowest True Range in history, could we soon see the largest price movement ever?
Bollinger Bands Point To Sizable Move When Tight Range Finally Breaks
Another tool underscoring that the sideways price action has reached record lows in volatility is the Bollinger Bands technical analysis indicator.
The indicator consists of a simple moving average and two standard deviations that act as the upper and lower “bands.”
Related Reading | How Lengthening Bitcoin Cycles Conflict With Halving Driven Supply Theories
These bands widen and contract depending on volatility and corresponding price action. When the Bollinger Bands “squeeze” and tighten, an explosive move always follows.
The Bollinger Bands have now reached their tightest point since the November 2018 drop taking Bitcoin to its bear market bottom at $3200.
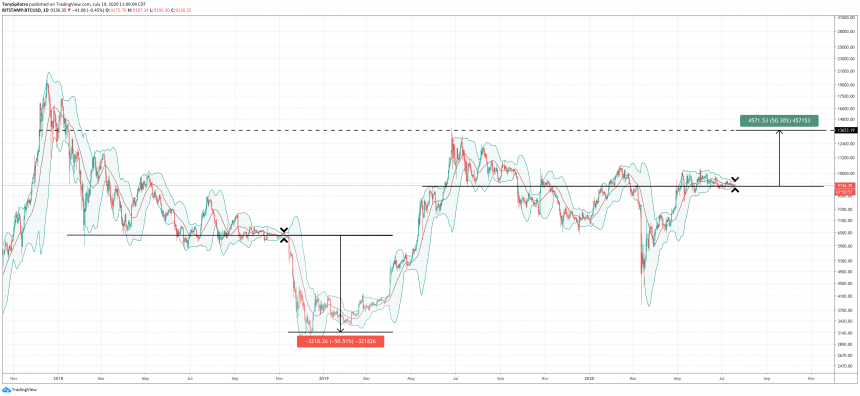
Bitcoin BTCUSD Bitstamp Bollinger Bands Daily | Source: TradingView
Ahead of the over 50% drop, a similar length sideways trading range took place, but the asset ultimately couldn’t hold repeatedly tested support. The support level at $6,000 held several times prior to the breakdown, but pent up momentum during sideways action once released provided enough strength for the collapse.
This time around, however, it’s resistance at $10,000 that has repeatedly been tested. Could this time send BTCUSD flying high, perhaps retesting $14,000 where the last major rejection took place?
If Bitcoin can break above that level, a retest of the cryptocurrency’s all-time high is very likely. However, if Bitcoin breaks down from here, a lower low may be possible.
")

