

While it was just eight weeks ago that Bitcoin was trading at $3,700 in the depths of a bear market, key signals are already showing BTC is just entering a bull market.
One such signal, an indicator that purportedly has an 8/8 or 100% strike rate, just appeared on Bitcoin’s chart, a top analyst has observed.
Bitcoin Prints Extremely Strong Buy Signal
According to a top crypto trader, the Super Guppy indicator just flipped green on Bitcoin’s daily chart, which is a sign that “we will likely go higher.”
The Super Guppy is an indicator that uses a confluence of moving averages to predict when a market is trending bullish, neutral, or bearish, printing signals when certain averages exhibit certain behavior.
Chart from Altcoin Pyscho
Per the trader, the Super Guppy has a 100% strike rate for BTC, noting in his tweet that “historically speaking, green flips on bitcoin has led to higher price 8 out of 8 times.”
This is seemingly the case.
Below is a Tradingview.com chart created by NewsBTC of Bitcoin’s macro price index, the BraveNewCoin Index. Each red line seen in the chart below is when the Super Guppy turned from red/grey to green on the one-day chart.
As can be seen, sometimes the gains were small, other times they were large, but each instance of this indicator turning bullish that NewsBTC found was followed by increases in the Bitcoin price.
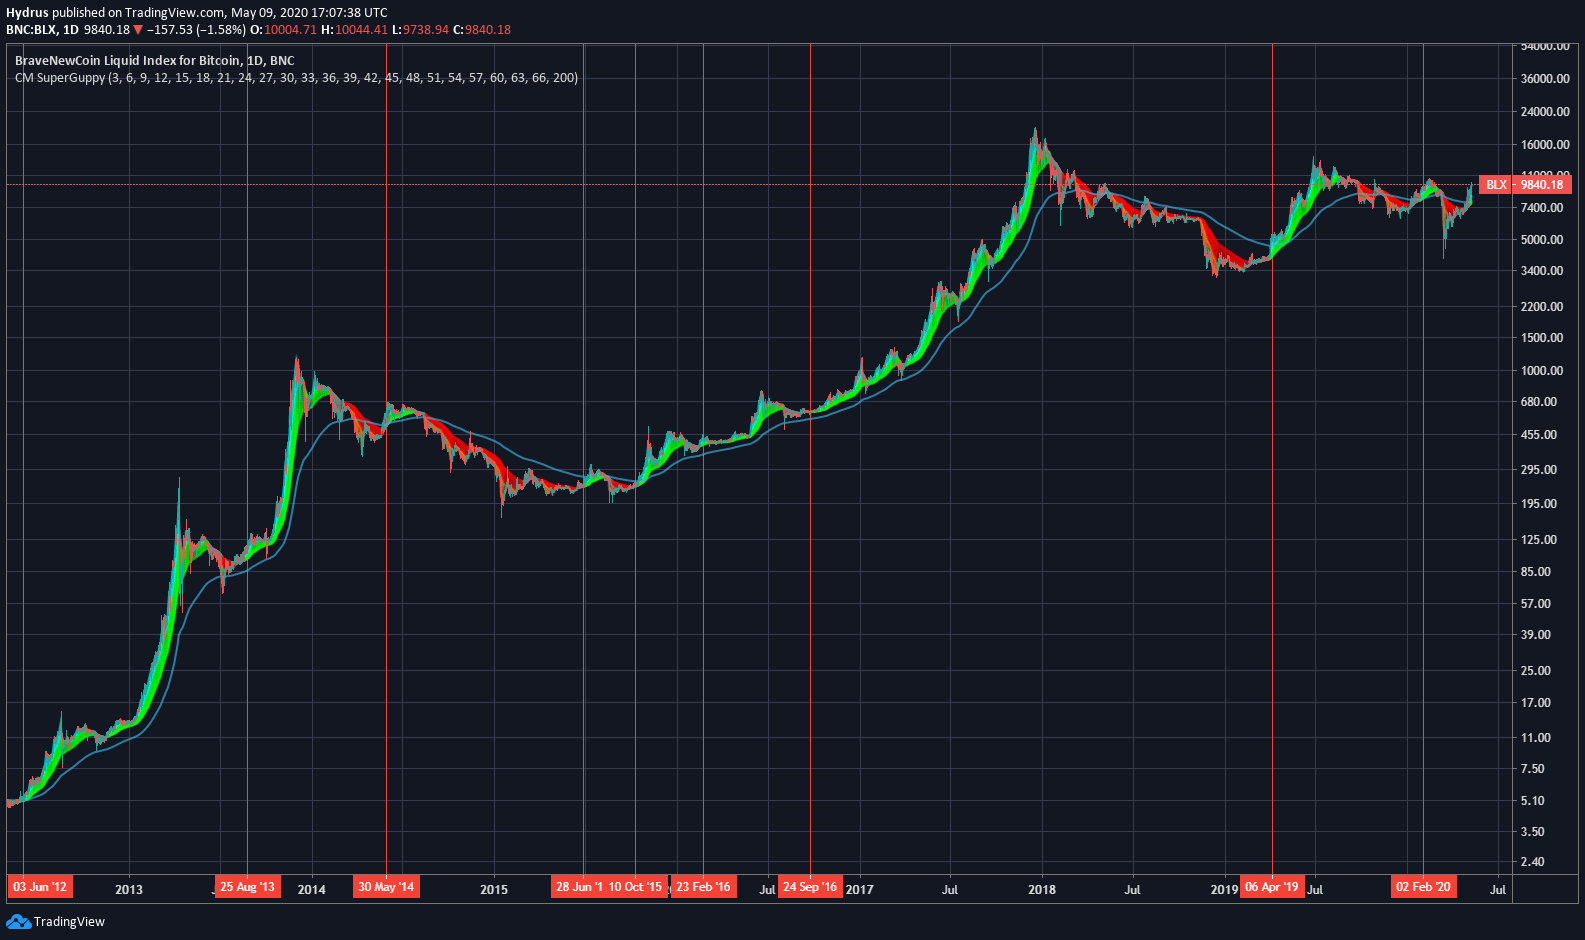
Chart of all historical Super Guppy instances on Bitcoin’s one-day chart from TradingView.com
The most notable of these was in late-2016, when the Guppy turned bullish while Bitcoin was trading under $1,000, but then rallied to $20,000 in the 15 months that followed.
Not the Only Bullish Sign
The Super Guppy flipping bullish is far from the only strong sign for Bitcoin.
A prominent analyst recently shared the chart below, showing Bitcoin’s macro two-week chart overlayed with a custom trend indicator.
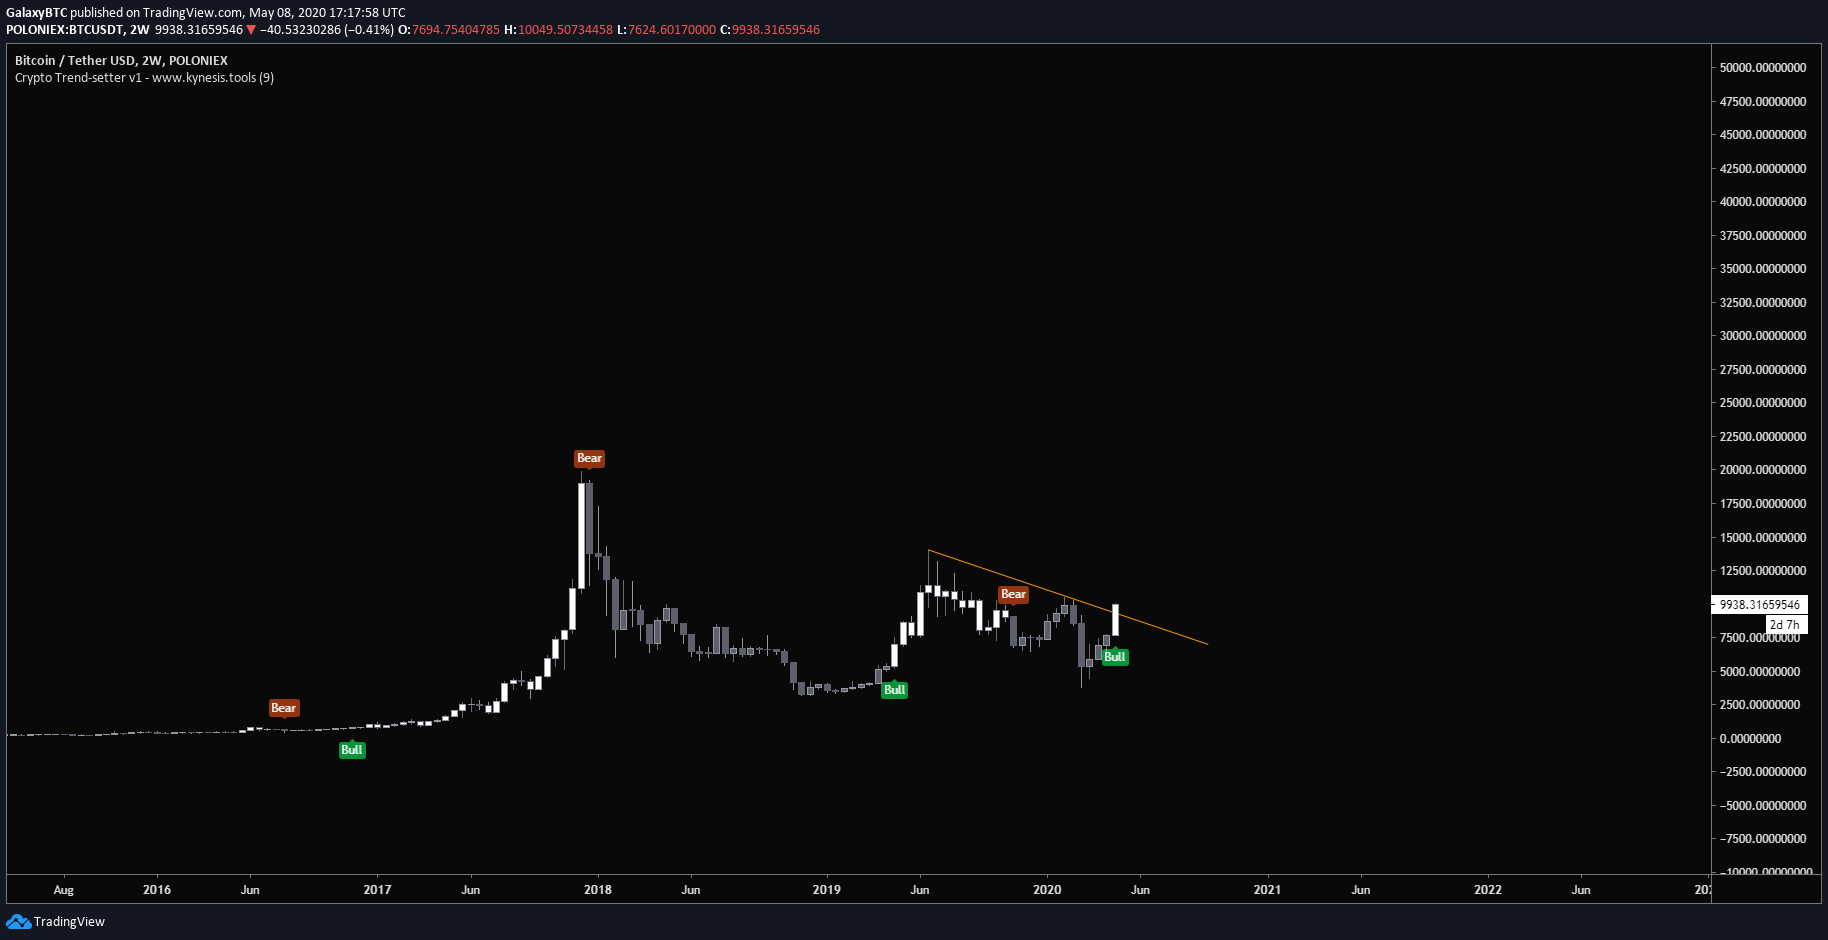
Chart from @GalaxyBTC, a prominent crypto trader. He predicts Bitcoin will “explode straight to $20,000.”
The chart also indicates that BTC broke past a downtrend that has persisted since the $14,000 highs in 2019.
The cryptocurrency also has macro fundamental tailwinds, four of which were recently identified by Fundstrat Global Advisors’ co-founder and head of research, Tom Lee. They are as follows:
- Bitcoin is the best-performing “asset class” in 2020, beating U.S. Treasuries and Gold amid a global recession.
- BTC was the best-performing asset class of 2019, rallying 92% while the U.S. stock market gained around 20%.
- The block reward reduction, known as a “halving,” is taking place in four days, estimates suggest.
- Paul Tudor Jones, one of the world’s biggest macro investors, just announced his fund is taking a stake in Bitcoin futures. Like many in the cryptocurrency space, Jones believes that BTC will act as a hedge against inflation and will benefit from the ongoing digitization of money.
Featured Image from Unsplash

 Decline Far From Over, Bears Eye $7.5K")
