

Bitcoin is currently correcting lower from the $9,950-$10,000 resistance zone against the US Dollar. BTC price is likely to bounce back as long as it is above the $9,500 support.
- Bitcoin is currently showing a few bearish signs, but it is still above key supports such as $9,500.
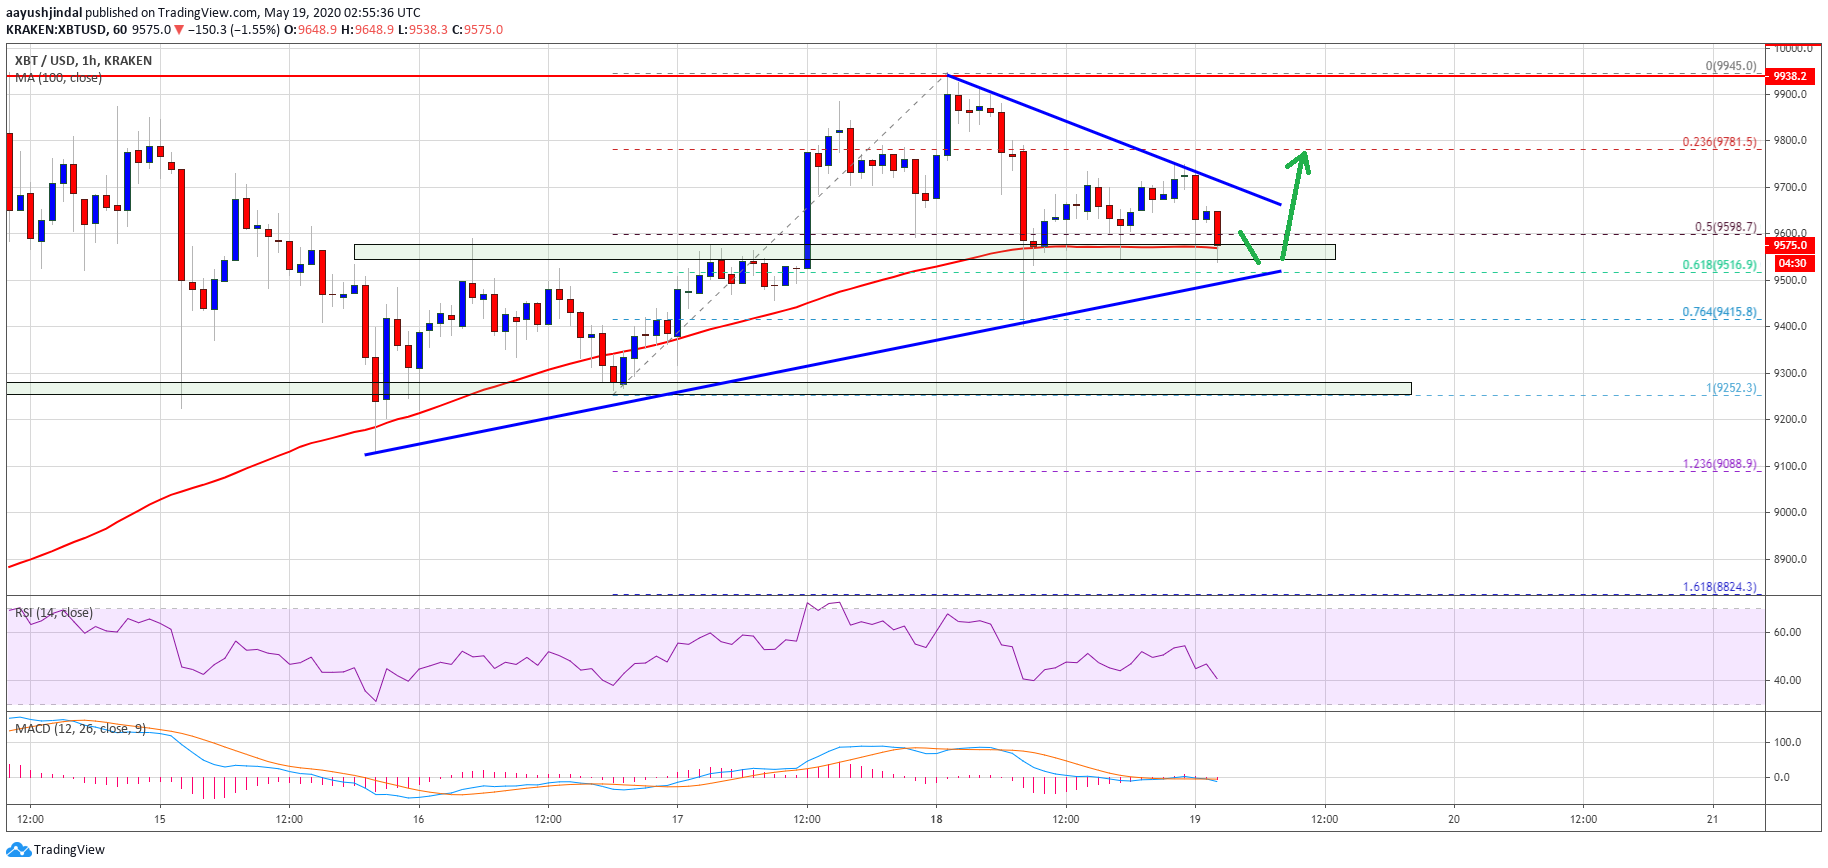
- The price is finding a strong buying interest near $9,560 and the 100 hourly simple moving average.
- There is a major contracting triangle forming with resistance near $9,700 on the hourly chart of the BTC/USD pair (data feed from Kraken).
- The pair could surge towards $10,000 unless it breaks the $9,500 support and the 100 hourly SMA.
Bitcoin Testing Key Supports
Bitcoin retested the $9,950-$10,000 resistance zone against the US Dollar, but it failed to continue higher. BTC price traded as high as $9,945 and recently started a downside correction.
It failed to stay above the $9,800 and $9,700 levels. The decline was such that the price even spiked below the 50% Fib retracement level of the upward move from the $9,252 low to $9,945 high.
However, bitcoin is currently finding a strong buying interest above the $9,500 level and the 100 hourly simple moving average. The 61.8% Fib retracement level of the upward move from the $9,252 low to $9,945 high is also protecting more downsides. A confluence of these three factors could prevent a downside break and the price might start a fresh increase towards $10,000.
It seems like there is a major contracting triangle forming with resistance near $9,700 on the hourly chart of the BTC/USD pair. If the pair breaks the triangle resistance, it could start a fresh increase in the near term above $9,750.
The first major resistance is near the $9,780 and $9,800. The main resistance is still near the $9,950-$10,000 zone, above which there are high chances of a sustained upward move in the coming days.
Bearish Break?
If bitcoin fails to climb higher above $9,700 and $9,800, it could react to the downside. A clear break below the triangle support, $9,500, and the 100 hourly SMA might initiate more losses.
The next key support is near the $9,400 level, below which the price is likely to continue lower towards the $9,250 support level. Any further losses may perhaps push the prince in a downtrend towards the $8,500 level.
Technical indicators:
Hourly MACD – The MACD is currently moving in the bearish zone, with negative signs.
Hourly RSI (Relative Strength Index) – The RSI for BTC/USD is now just below the 50 level.
Major Support Levels – $9,500 followed by $9,250.
Major Resistance Levels – $9,700, $9,800 and $10,000.
Featured image from unsplash.


