

Ethereum has been outperforming most of the crypto market. It was also among the best-performing mainstream assets to invest in, with the $1,200 stimulus check. Those who did, more than doubled their money by putting it into the smart-contract-focused altcoin.
But it may now be “time to pay attention” as the creator of a popular technical analysis indicator, would say. The tool this wise trader and analyst created could be signaling that a between 50 and 70% drop in Ethereum is coming, according to how the tool is utilized.
Bollinger Bands Explained In Brief: Fast Facts On The Technical Analysis Tool
The Bollinger Bands are a technical analysis tool that is used to find support, resistance, gauge volatility, and act as a buy or sell signal. This extremely versatile tool is among the most popular tools among cryptocurrency analysts.
The tool itself was created by traditional market wiz John Bollinger. Bollinger, however, often watches cryptocurrencies and shares his commentary regarding Bitcoin and how it reacts with the indicator.
Related Reading | Easy Money? Coinbase Crypto Coins Grow Over 50% On Average In August
As someone who knows the tool inside and out, Bollinger regularly warns of “head fakes” or calls out when its “time to pay attention.”
Bollinger isn’t calling out one of those critical moments here, but that’s because he rarely comments on Ethereum. And its Ethereum that is exhibiting the ominous signal.
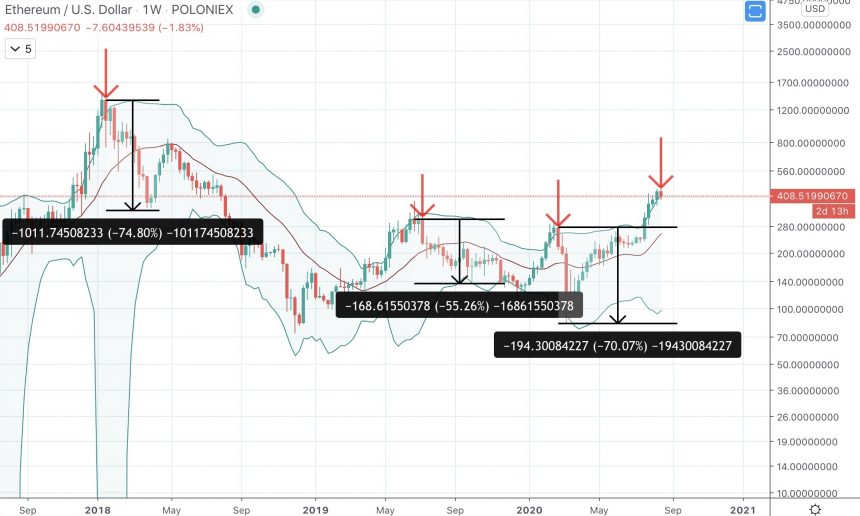
ETHUSD Weekly Bollinger Bands | Source: TradingView
Indicator Points To Between 50 and 70% Correction In Ethereum
Bollinger Bands are used all over the world of finance, not just crypto. But because cryptocurrencies are especially volatile, the volatility measuring tool can be especially handy.
When the tool squeezes, it means volatility is low and about to soon explode. When bands widen, it means volatility is highest.
As much as 90% of the price action takes place within the bands, so when assets close outside the bands, it is either a sign a reversal is near, or if supported by strong volume, strong continuation is likely.
When Ethereum first closed outside of the Bollinger Bands on its recent rally, volume helped carry the altcoin higher for three more consecutive weekly closes. The tide just recently started to turn on cryptocurrencies, just as the dollar began to rebound.
It has caused Ethereum to start to fall and is currently being supported by the upper Bollinger Band. Closing back inside the bands, likely means the rally is over, and significant downside will follow.
This scenario is one of the downsides of crypto assets growing so quickly – they correct even harder than most other assets. This is also why the Bollinger Bands are so helpful in cryptocurrency technical analysis.
In the past, Ethereum closing back inside the Bollinger Bands after a strong rally resulted in a between 50% and 70% crash (pictured above).
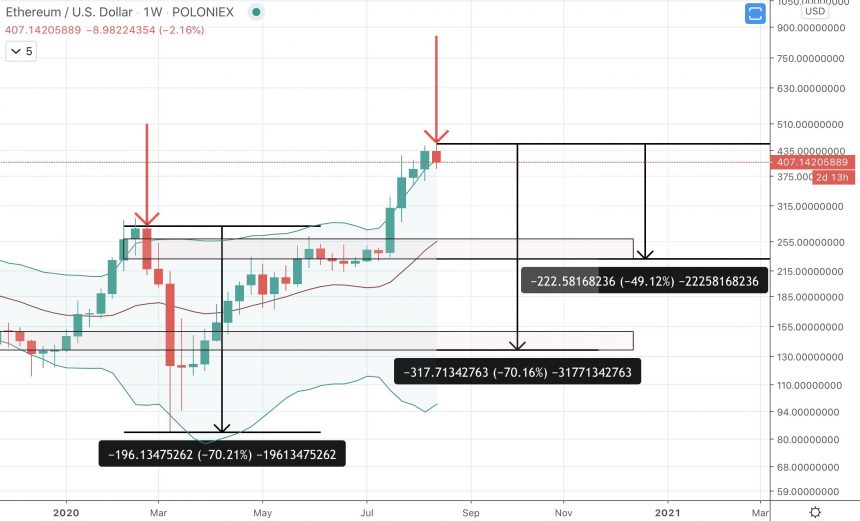
ETHUSD Weekly Bollinger Bands | Source: TradingView
A 50% fall from the current high, would take Ethereum back to around $240-250 to confirm the level as support. If the retracement happens to go deeper – as much as the higher end of the data – Ethereum could drop back to prices around $140.
Related Reading | Ethereum Beats Bitcoin, Gold, and Stocks In Stimulus Check Investment
That deep of a retracement at this point seems unlikely, but past corrections have resulted in as much. Ethereum’s all-time high, where the first major weekly close back within the Bollinger Bands took place, resulted in a more than 90% fall.
The 2019 top to Black Thursday, took Ethereum down 70% again. Will the third time be the charm and final fall before the bull market begins?


 Is Slowly Turning Sell On Rallies")