

Bitcoin appears to be in a somewhat precarious position, as a few technical factors are currently suggesting that it may soon see some notable near-term downside.
One such technical factor suggesting that the crypto is poised to see notable near-term downside can be seen while looking towards a fractal pattern it has been developing over the past few weeks.
This fractal is similar to one formed in the summer of 2019 and signals that the crypto could soon see some notable losses.
Specifically, one analyst is looking for a retrace towards its 0.50 Fibonacci level, which could result in a 30% decline against its USD trading pair.
This decline would lead the benchmark digital asset towards $7,000.
Other technical factors support this possibility, including an ongoing squeeze on BTC’s daily Bollinger Bands, which are currently at their tightest levels seen since October of 2018.
Bitcoin is Gearing Up for a Massive Movement, Technical Indicator Shows
At the time of writing, Bitcoin is trading up slightly at its current price of $9,160. This is around the level at which it has been trading throughout the past week.
Although the selling pressure within the mid-$9,000 region has proven to be significant, bulls have continued ardently defending against a decline beneath $9,000.
This has caused the crypto’s consolidation phase to condense, with BTC now ranging between $9,100 and $9,300.
The lack of direction that the cryptocurrency has posted in recent weeks simply marks an extension of the macro consolidation phase that it has been caught within since early-May.
This trend may soon come to a firm end. One analyst recently pointed out that Bitcoin’s Bollinger Bands are now the tightest they have been since October of 2018.
The last time they were this tight, the cryptocurrency underwent a massive decline that sent it from $6,000 down to the $3,000 region.
“Bitcoin – Daily BBs have not been this tight since October of 2018 – I hope you have your popcorn ready.”
Image Courtesy of Big Cheds. Chart via TradingView.
Fractal Suggests BTC May Soon Reel by 30%
One fractal pattern Bitcoin has formed suggests downside could be imminent.
While speaking about this pattern, an analyst noted that he is expecting it to see a 50% Fibonacci retrace.
The analyst further went on to explain that a retrace to the 0.5 fib level translates into a roughly 30% decline against Bitcoin’s USD trading pair. This means it could soon be trading at $7,000.
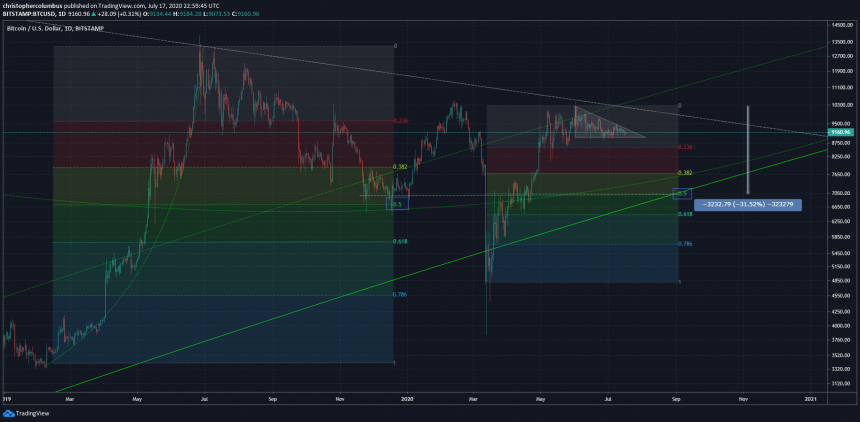
Image Courtesy of Dave the Wave. Chart via TradingView.
If this decline takes place, it could also create a cascade of liquidations that cause its price to decline even further.
Featured image from Unsplash.

Charts from TradingView.


