

Bitcoin has been going wild over the past few hours. Its price surged rapidly towards $9,900, but an internal issue on BitMEX caused this platform to go down affecting the flagship cryptocurrency.
Following the incident, Bitcoin took a 3.5% nosedive erasing the gains made today.
Data from Datamish shows that $11.4 million of long positions and nearly $6 million worth of short contracts were liquidated on the Seychelles-based crypto derivatives exchange in the past 24 hours alone.
The last time BitMEX experienced a system outage was on March 13, which resulted in mass liquidations that pushed the price of Bitcoin below $4,000. While the implications of the recent downtime are yet to be seen, on-chain metrics suggest that Bitcoin is bound for a bearish impulse.
A Steep Correction on Bitcoin’s Horizon
While the flagship cryptocurrency continues to re-test the $10,000 resistance level, its on-chain volume appears to have “leveled off,” according to Santiment.
The behavior analytics platform explained in a recent blog post that Bitcoin’s on-chain volume has been steadily declining even though its price remains trading above $9,500. The major divergence between price and volume may suggest that BTC could be poised for a correction.
“We wouldn’t be surprised to see another re-test of $9,000 – $9,200 sometime this week before some buy orders coming to the rescue,” said Brian Quinlivan, Marketing and Social Media Director at Santiment.
Bitcoin’s On-Chain Volume. (Source: Santiment)
Bitcoin’s daily active addresses also appear to have peaked on May 7. Since then, this on-chain metric has been making a series of lower highs. It has dropped from a high of 1 million daily active addresses to 964,000.
Such a decline in the activity of the network is usually seen as a negative sign, which adds credence to the bearish divergence seen between Bitcoin’s price and its on-chain volume.
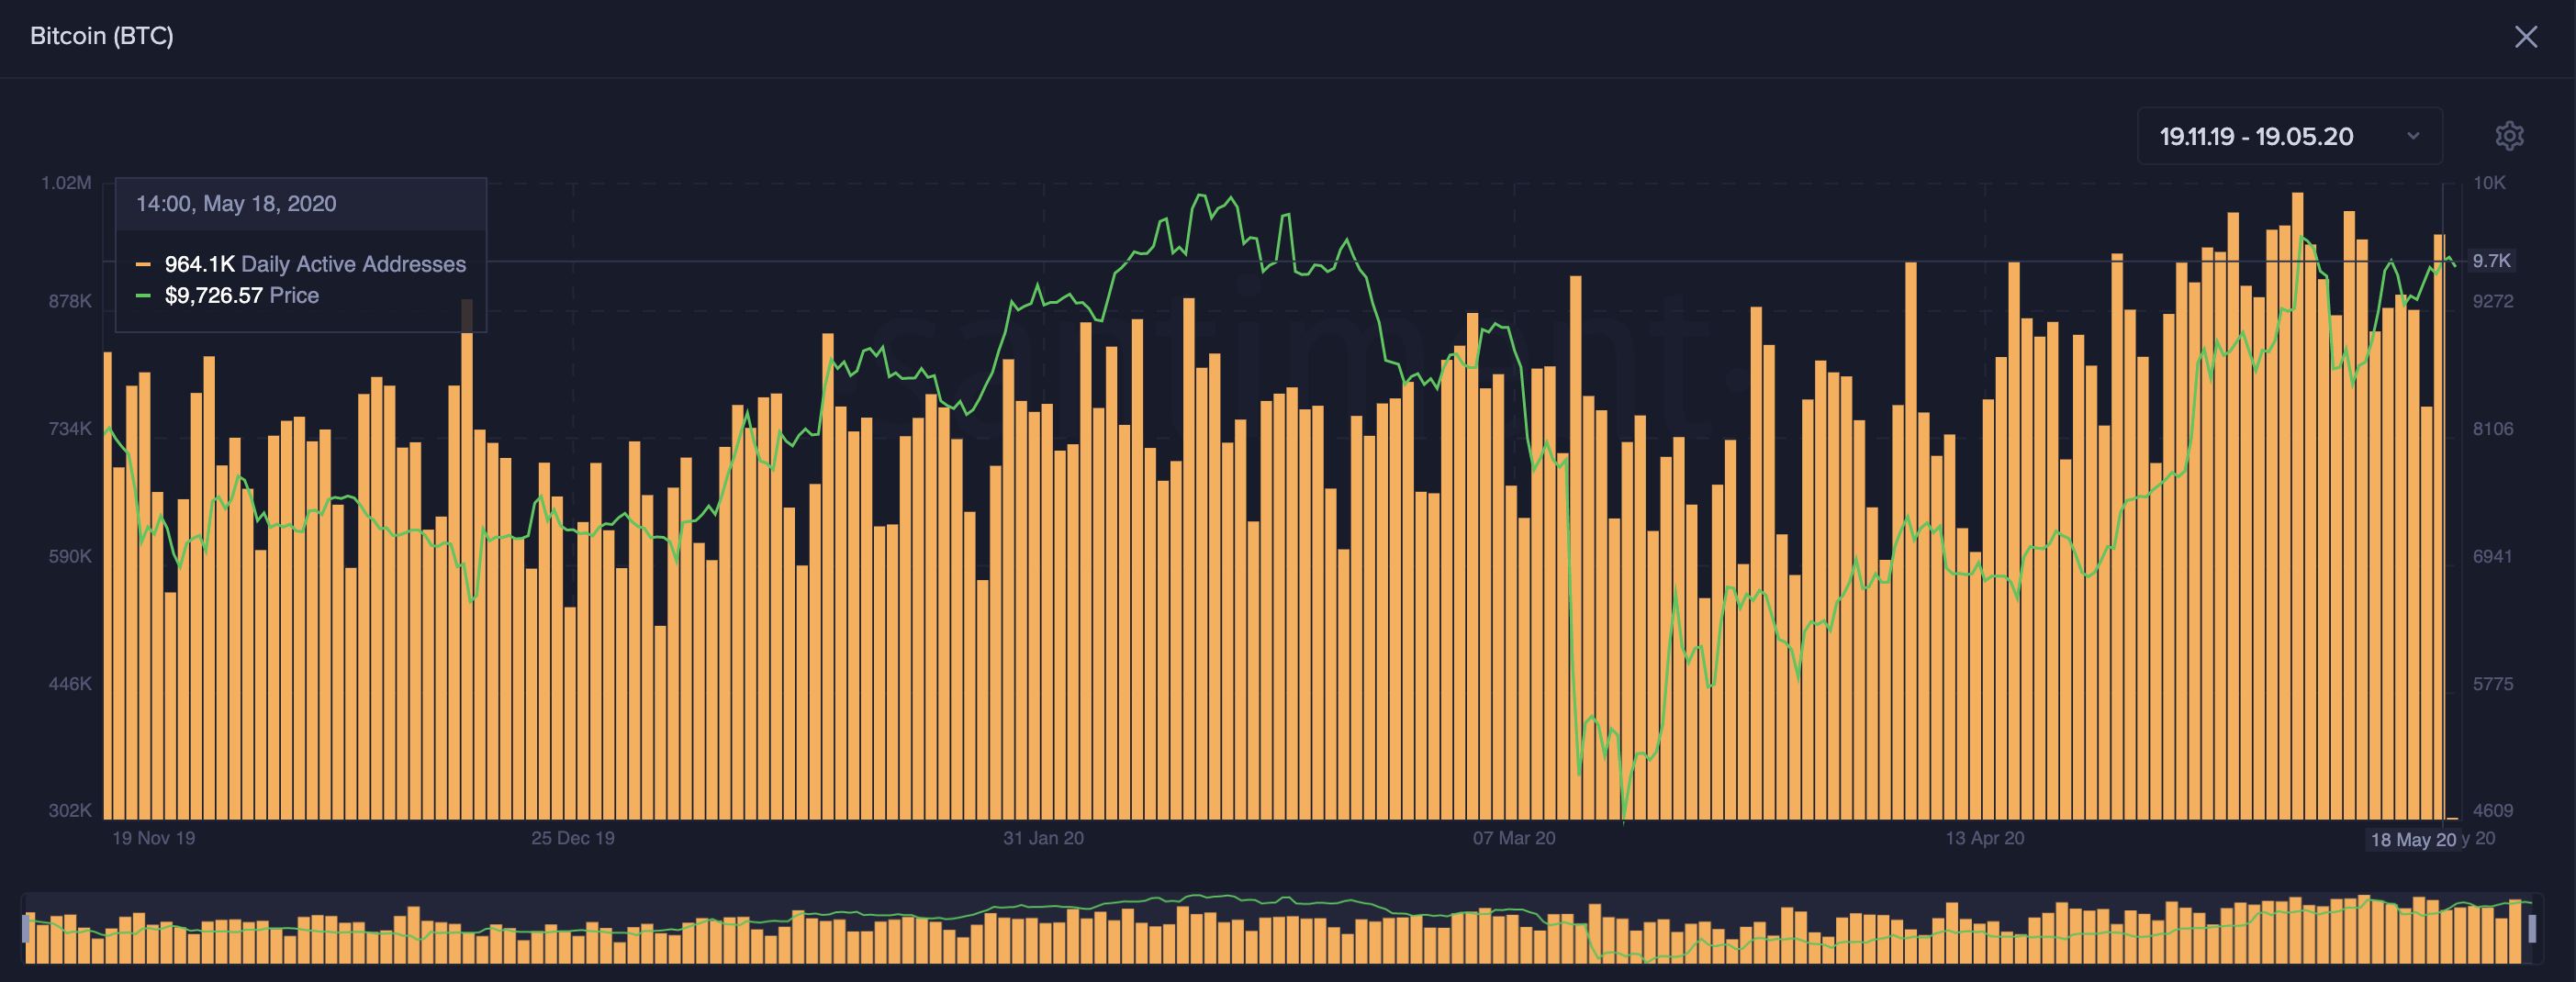
Bitcoin’s Daily Active Addresses. (Source: Santiment)
Considering that there are entities and individuals who own millions of dollars of worth of BTC, colloquially known as whales by crypto traders, a look at what they are doing can provide a clear picture of what it is being planned behind closed doors.
These so-called “whales” have a disproportionate impact on prices because of their enormous holdings and their ability to coordinate buying and selling activity.
Prior to the recent halving, the number of addresses with 1,000 to 10,000 BTC began increasing quickly fueling Bitcoin’s rise towards $10,000. However, these large holders appear to be slowly selling their holdings, which may lead to a steep correction.
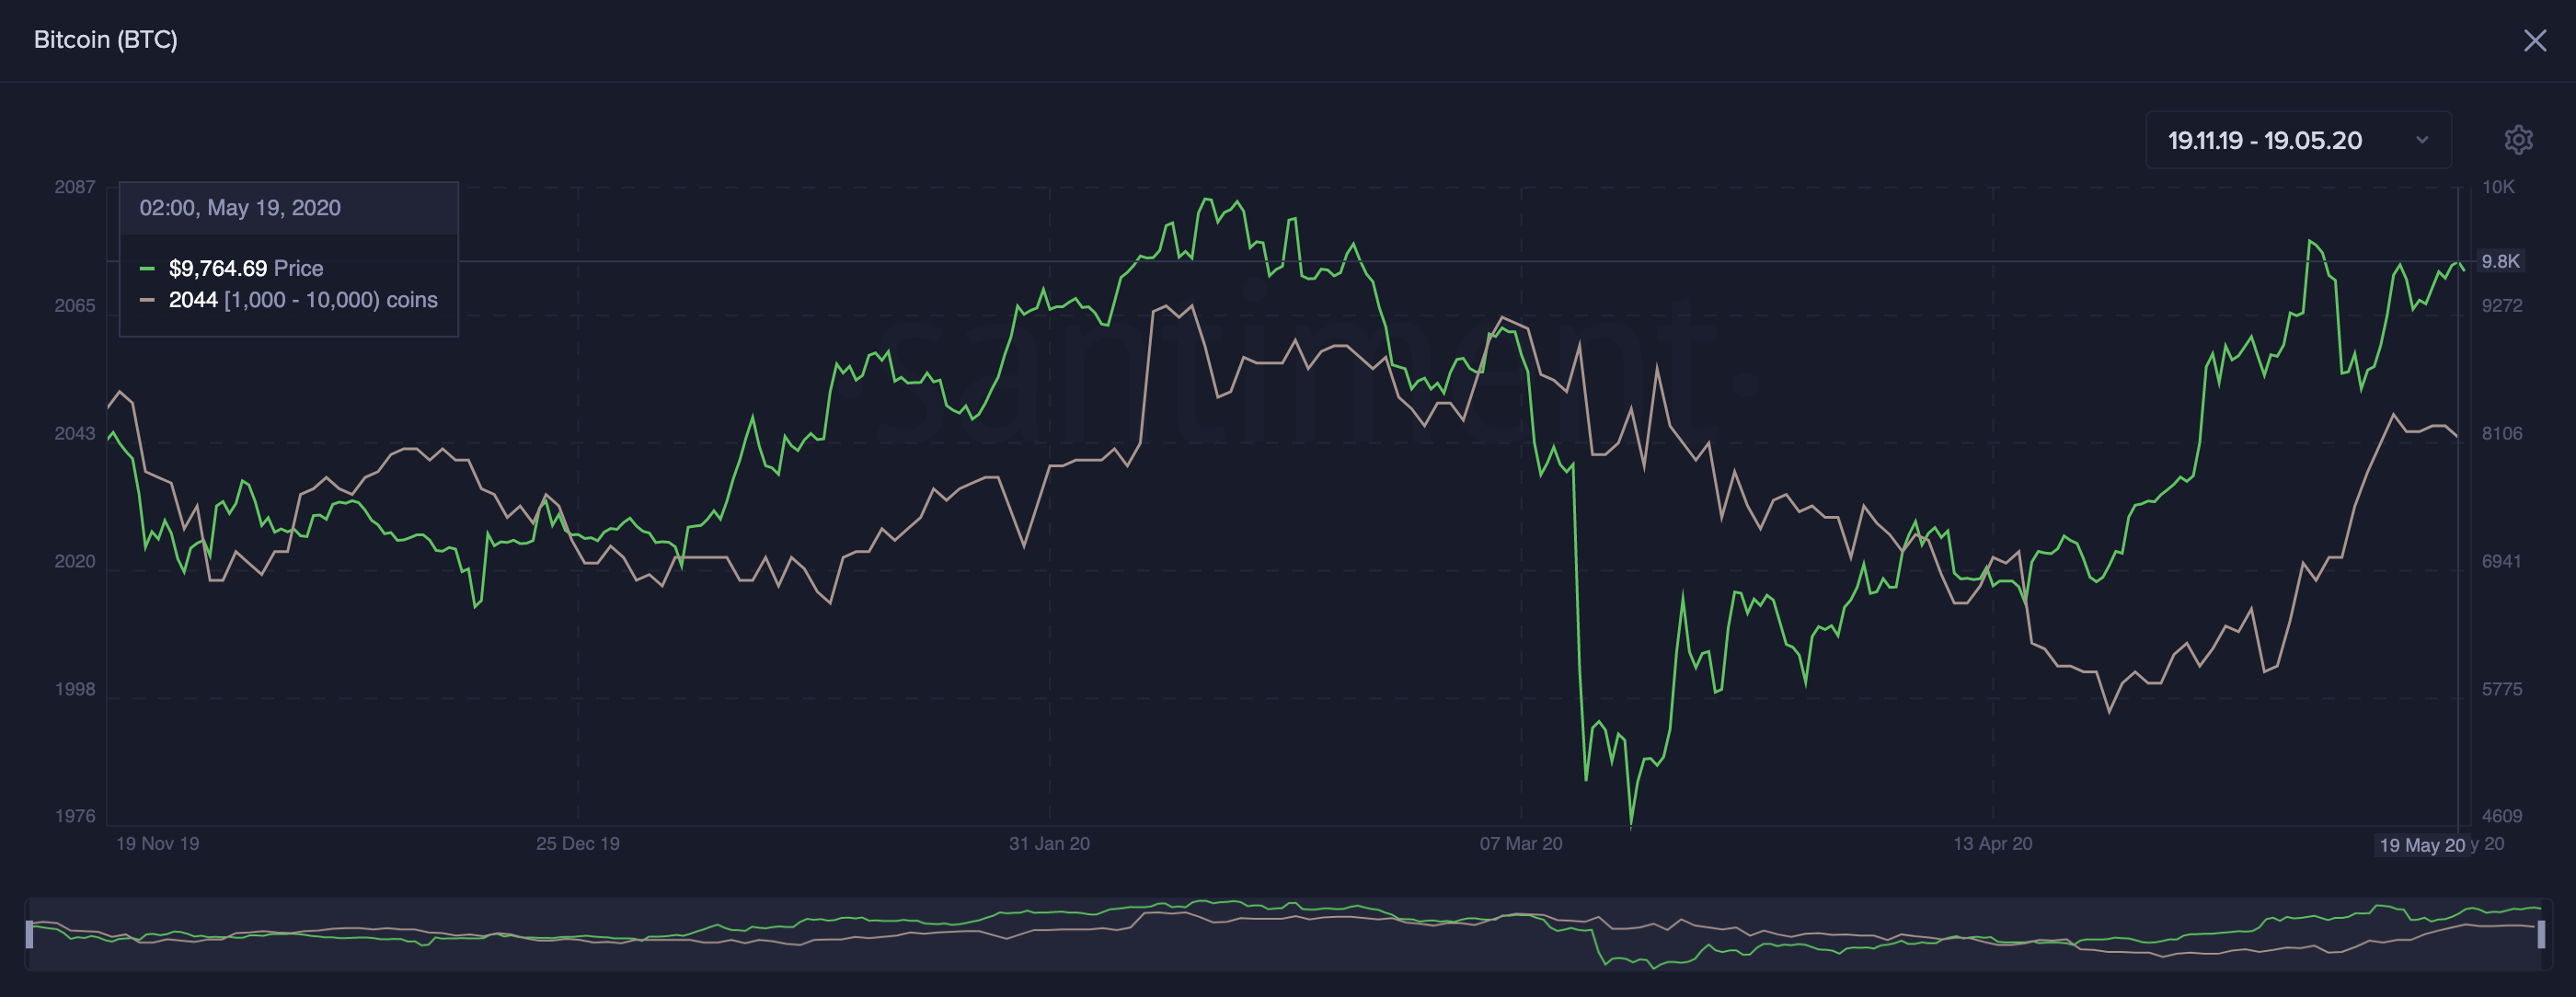
Bitcoin’s Holders Distribution. (Source: Santiment)
Key Support and Resistance Levels to Watch Out
Out of all Bitcoin addresses, more than 69% are currently “In the Money,” while 27% are “Out of the Money,” according to IntoTheBlock’s “In/Out of the Money Around Price” (IOMAP) model.
These figures may indicate that the investor base behind BTC is confident about a further upward advance. But the wisdom of the crowd is usually inaccurate signaling that one must be cautious about a potential downturn.
Looking at IOMAP cohorts shows that more than 1.4 million addresses bought over 840,000 BTC at an average price of about $9,500. This price level represents a massive supply wall and will likely provide strong support if the bellwether cryptocurrency were to decline.
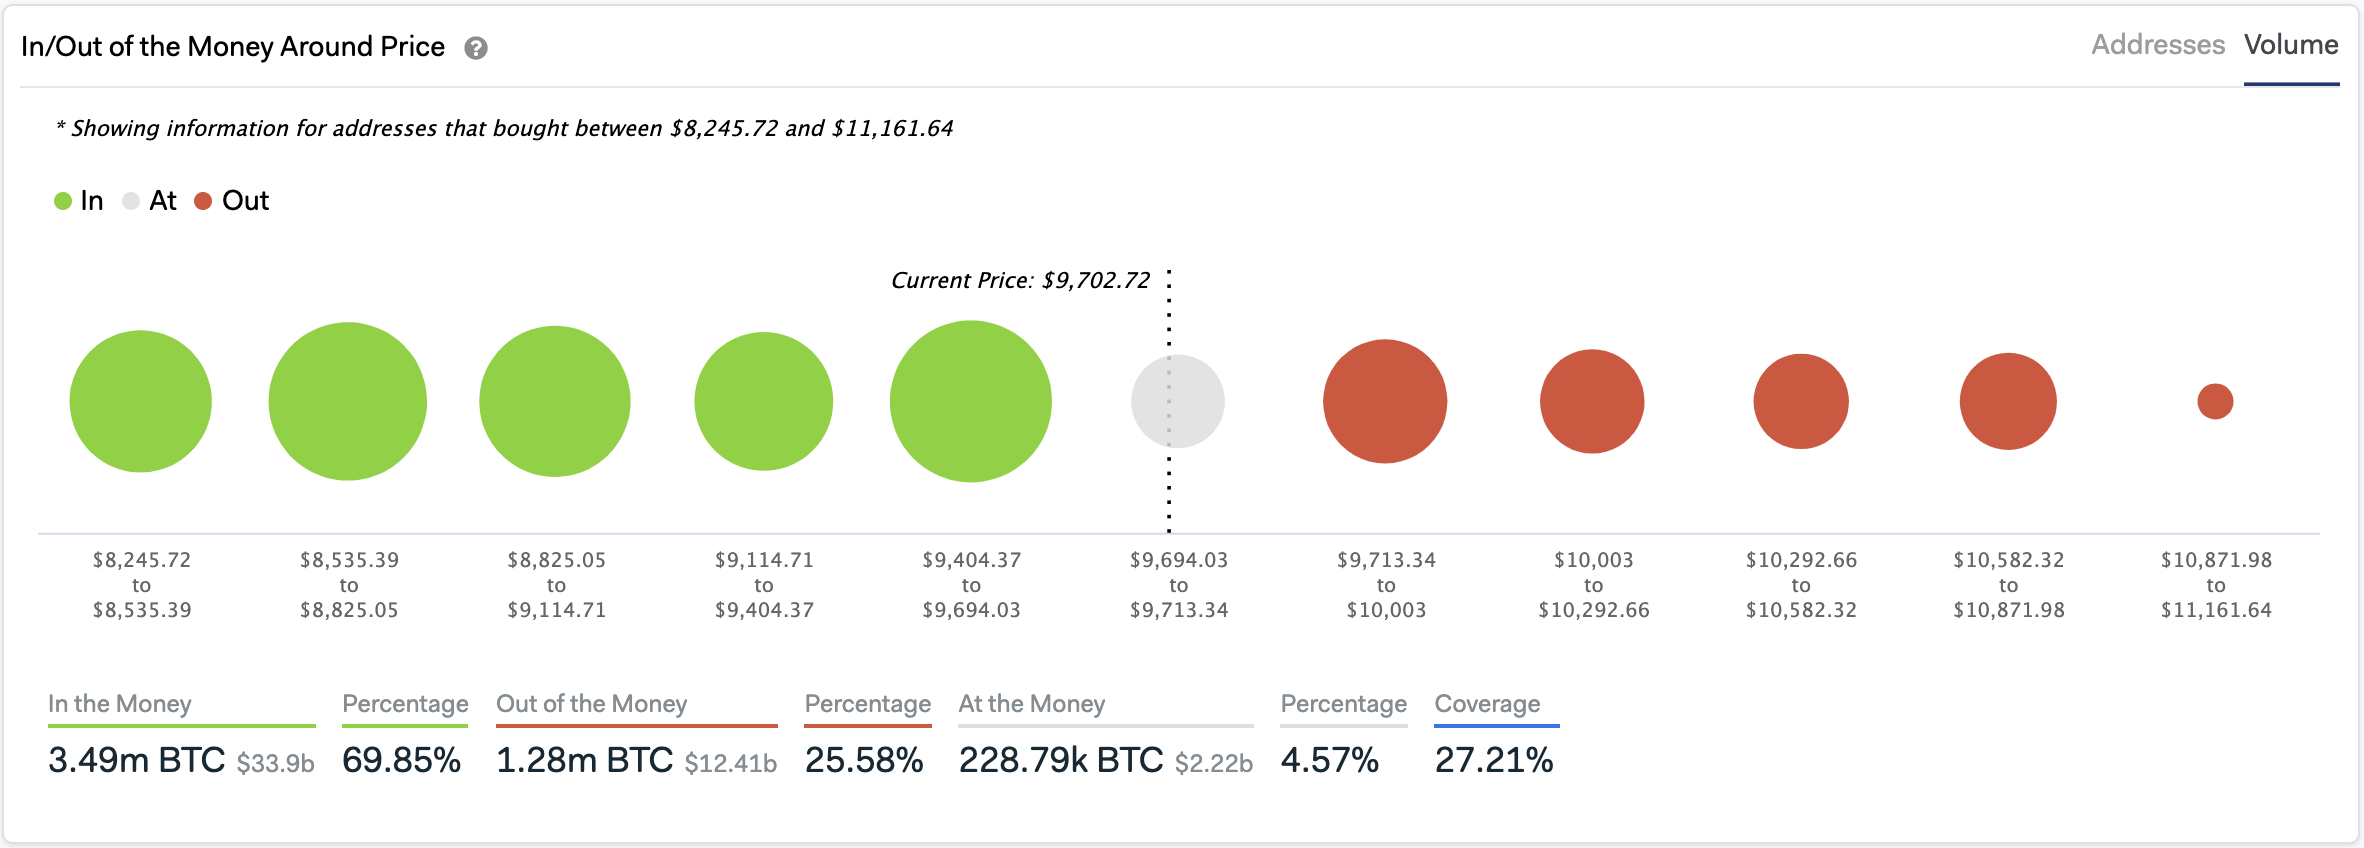
In/Out of the Money Around Price. (Source: IntoTheBlock)
On the flip side, the resistance level above sits between $9,700 and $10,000. Here, 756,000 addresses purchased roughly 480,000 BTC.
Even though the different metrics explained above seem to indicate that the bellwether cryptocurrency is bound for a retracement, one must wait for a clear break of the aforementioned support or resistance levels. Moving past either of these barriers will provide a better idea about where BTC is headed next.


